Introduction: Understanding post-infarct VT substrate relies on a combination of voltage and activation mapping. These maps are often analysed separately. Omnipolar electrograms (Omni-EGMs) offer a novel approach to mapping, with local activation displayed as a vector. We describe an approach to characterize the post-infarct ventricular arrhythmic substrate using omni-vectors superimposed onto omni-voltage maps for review ‘in tandem’.
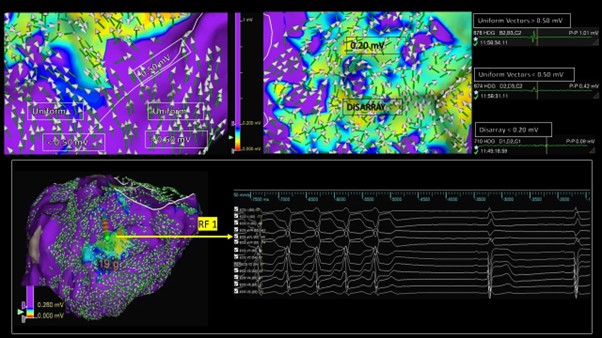
Methods: Consecutive patients who underwent VT substrate mapping (EnSite X + HD Grid catheter) using omnipolar technology (OT) at our institution were retrospectively studied. Omni-voltage maps were displayed between 0–1.5 Mv, with tissue >1.5 Mv coloured purple, and tissue below coloured according to the rainbow spectrum between red (lowest voltage) to blue. Omni-vectors were superimposed onto omni-voltage maps. Vectors were either categorized as pointing in the same direction, suggesting activation ‘uniformity’, or in multiple unpredictable directions, suggesting ‘vector disarray’ (VD). This is demonstrated in Figure 1 (top panel). The upper voltage limit on the omni-voltage map was sequentially reduced until only those areas with VD appeared ‘non purple’ – this voltage limit was termed the ‘vector disarray threshold’ (VD-Th) and was identified in each patient. We compared the location of the putative VT isthmus relative to areas of VD.
Results: Ten consecutive patients post-MI (mean age 61 ± 14 years; mean LVEF 34 ± 7%, median 3 [IQR: 2–5.5] VT episodes in the prior 3 months) were studied. Dense LV substrate maps (4,232 ± 2,608 points) were collected with the HD Grid catheter. Three patients were also mapped in VT. The mean VD-Th was 0.26 Mv (range: 0.18–0.50 Mv). VD covered a significantly smaller shell area then the traditional 0.50 Mv voltage threshold used to define scar (16.1 ± 11.0 versus 44.0 ± 22.6 cm2, p<0.01). VT isthmus components collocated within tissue bordering the VD-Th. In patients who could not be mapped in VT, pace-mapping within the VD-Th border zone offered excellent correlation to clinical VTs. The figure demonstrates VT termination with radiofrequency ablation (RF-1) in the VD-border zone of an inferior scar. A mean of 21.3 ± 7.3 mins of substrate ablation was delivered, with most lesions collocating within and around the VD-Th. VT was non-inducible in 9 (90%) patients post-ablation, with a significant VT burden reduction in early follow-up: median 0 episodes at 3 months post-ablation, p<0.01.
Conclusions: Omni-vectors within post-infarct ventricular tissue can appear organised (uniform) or in disarray. When studied in tandem with a voltage map, disarray is observed at voltages considerably lower than the traditional 0.50 Mv threshold used to define scar. Low voltage tissue bordering vector disarray appears to correlate with VT isthmus components, potentially identifying ablation targets. ❑
Figure 1


