Introduction: Identifying ablation targets for persistent atrial fibrillation (PersAF) remains challenging. Dominant frequency (DF) and organization index (OI) of atrial electrograms (AEGs) are proposed to identify driver sites that contribute to AF perpetuation. This work aims to use DF and OI together to identify atrial regions with organised, fast activation rates based on electrophysiologic responses following AF substrate ablation.
Methods: 2,048 channels of non-contacting AEGs (60 s, EnSite Array, Abbott) were analysed from 10 patients with PersAF undergoing highest DF-guided ablation with no prior ablation history. After QRST subtraction, AEGs were divided into 15 segments (4 s each, 50% overlap). The fast Fourier transform (FFT) was used to calculate (DF 4–10 Hz, and OI). Segments with (DF 4–10 Hz, and OI >0.4) were selected as highly organised DF (HODF). The change in AF cycle length (AFCL) was measured pre- and post-ablation (≥10 ms considered significant). AF termination is defined as either converting AF to sinus rhythm (SR) or converting AF into an organised rhythm within the left atrium (LA). AEGs were classified into two groups: those collected from regions where ablation led to a AFCL increase (≥10 ms) and those with a AFCL non-increase (<10 ms). Spatial analysis compared pre-ablation HODF sites with sites with AFCL changes during ablation for terminated and non-terminated patients.
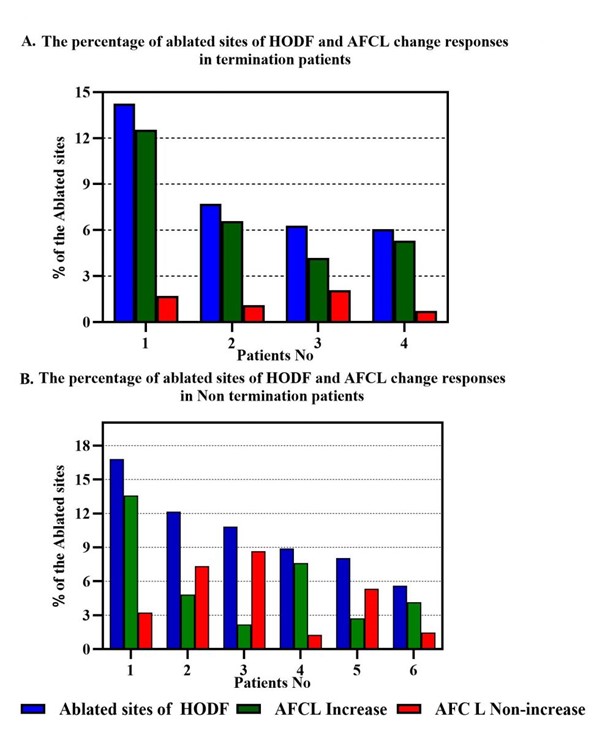
Results: A total of (3,206 AEGs) were analysed for 10 patients: AFCL increased in 30% of ablated AEGs, and AFCL did not increase in 70% of ablated AEGs. Although the percentages of non-ablated HODF sites were high in terminated and non-terminated patients (mean ± SD: 91 ± 2.9), the results indicate a good spatial correlation between the ablated HODF sites and sites of AFCL increase in terminated compared to non-terminated patients (see Figure 1, A and B). DF were higher and more organised in terminated patients pre-ablation compared with non-terminated (DF: 5.82 ± 1.9 Hz, OI: 0.42 ± 1.49 versus DF: 5.2 ± 0.8 Hz, OI: 0.32 ± 1.14, P<0.001 respectively). Post-ablation HODF in terminated patients showed a significant reduction (pre: 5.72 ± 1.9 Hz versus post: 4.2 ± 0.5 Hz, p<0.001). In contrast, non-terminated patients exhibited no significant change in HODF (mean ± SD: pre: 5.54 ± 1.62 Hz versus post: 5.2 ± 0.8 Hz, p=ns).
Conclusions: DF and OI have been suggested individually for guiding ablation. Our findings indicate that combining DF and OI might help identify AF substrates with organised, rapid activation rates for ablation substrates. Adaptable thresholds of DF and OI might help improve the characterization of AF substrates for each patient. ❑

Figure 1
A: the blue bars in the graphs represent the percentage of ablated HODF sites out of the total sites exhibiting HODF and AFCL change responses. Green bars indicate an increase in AFCL, while red bars represent a non-increase in AFC termination in patients. B: non-terminated patients.


