Heart failure (HF) is a complex and progressive clinical syndrome that significantly impacts morbidity, mortality and quality of life (QoL).1 On a global scale, HF has become an escalating public health concern, affecting more than 64 million individuals in 2017, and this number is still expected to continue increasing each year.1,2 Based on echocardiographic results from cohort studies among general populations in developed countries, HF affects 11.8% of populations older than 60 years and 1% of populations younger than 60 years.3 As the general population continues to age, the prevalence of HF rises, thereby amplifying the global burden on individuals and public health systems, while also reducing the QoL for patients and their caregivers.4,5
According to the 2022 guidelines established by the American Heart Association (AHA), managing HF includes various strategies, such as integrating exercise.6 Exercise training has been proven safe for individuals with HF and has multiple advantages. A significant clinical trial on exercise and HF demonstrated that, after adjusting for risk factors, exercise training was linked to a lower incidence of cardiovascular disease (CVD) mortality and hospitalizations in the group undergoing exercise training.7 Moreover, exercise has shown multiple benefits in terms of improving the function of various clinically significant parameters, such as aerobic capacity, cardiac function and structure and numerous other parameters.8–10
Current cardiac rehabilitation programmes commonly employ low- to moderate-intensity continuous training (MICT) as a method of intervention for the rehabilitation therapy, which is performed continuously for 10–30 min.11,12 Another alternative form of intervention, high-intensity interval training (HIIT), has also been established as an effective training in healthy adults as the HIIT aims to produce higher intensity over a given duration while allowing participants to alternate with recovery intervals at a lower intensity.12 Several studies have compared both interventions but have reached different conclusions.13–18 Some studies suggest that HIIT may provide superior improvements in peak oxygen uptake (peak VO2) and cardiac function, making it a potentially more effective option for enhancing exercise capacity in patients.19 Conversely, other research indicates that MICT is better tolerated, safer and equally effective in improving QoL and reducing hospitalization rates.20 These conflicting findings highlight the need for a comprehensive analysis to determine the most appropriate exercise strategy for patients with HF. Hence, this systematic review and meta-analysis aim to analyse and compare the efficacy of HIIT and MICT in the supplementary management of HF.
Method
Study design and protocol registration
This systematic review and meta-analysis was conducted following the Preferred Reporting Items for Systematic Reviews and Meta-Analyses (PRISMA) 2020 guidelines and guided by the Cochrane Handbook for Systematic Reviews of Interventions.21,22 The study protocol was reviewed by the International Prospective Register of Systematic Reviews (PROSPERO) and assigned the registration number CRD42024602309 on 27 October 2024.
Search strategies
A computerized systematic literature data search of relevant studies was conducted across 10 databases, including PubMed, Cochrane, Scopus, Web of Science, ProQuest, PubMed Central (PMC), Wiley, Embase, Google Scholar and EBSCO up to 3 January 2025. The search terms were formulated and combined using the Boolean operators ‘AND’ and ‘OR’: (‘High Intensity Interval Training’ OR ‘High-Intensity Interval Trainings’ OR ‘High-Intensity Intermittent Exercise’ OR ‘High-Intensity Intermittent Exercises’ OR ‘Sprint Interval Training’ OR ‘Sprint Interval Trainings’) AND (‘moderate-intensity continuous training’) AND (‘heart failure’ OR ‘Cardiac Failure’ OR ‘Heart Decompensation’ OR ‘Right-Sided Heart Failure’ OR ‘Right Sided Heart Failure’ OR ‘Left-Sided Heart Failure’ OR ‘Left Sided Heart Failure’ OR ‘Myocardial Failure’). No restrictions were applied regarding publication date or language in any of the searches.
Screening and data extraction
Database screening was independently conducted by Felicia Gunawan, Stevanus Surya, and Juan Alessandro across the 10 databases. After removing duplicates, the remaining articles were reviewed based on titles and abstracts. Following the independent review, the authors cross-verified the eligibility of each study based on predefined criteria. Reasons for excluding studies at each step were documented in a spreadsheet. Any disagreements were resolved through detailed discussions. Studies that met the criteria were extracted, with the data organized into a Microsoft Excel 2021 spreadsheet. The extracted data included outcome measures such as QoL, the six-min walk test (6MWT), left ventricular ejection fraction (LVEF), oxygen pulse and peak VO2, all reported as pre–post differences (Δ values). Additional information, including the country of origin, number of participants, gender distribution and intervention details, was also collected.
Eligibility criteria
The eligibility criteria were developed using the Population, Intervention, Comparison/Control, and Outcome (PICO) framework for systematic reviews.23 Studies were included if they met the following criteria:
-
the study population consisted of patients with HF
-
used HIIT as the intervention
-
used MICT as the control
-
evaluated QoL, 6MWT, LVEF, oxygen pulse and peak VO2 as outcomes
-
employed randomized controlled trial (RCT) studies.
Studies were excluded if:
-
the title or abstract was irrelevant
-
the full text was irretrievable
-
the study was a secondary analysis, review article, case report, case series or conference abstract.
Quality assessment
Bias assessment in randomized controlled studies was conducted using the Revised Tool for Risk of Bias in Randomized Trials (RoB 2.0) by two reviewers (Derren Rampengan and Stevanus Surya) with consensus resolution. The RoB 2 is a revised tool consisting of five bias domains explicitly designed to consider the risk of bias of randomized trials arising from:
-
the randomization process
-
deviations from intended interventions
-
missing outcome data
-
the measurement of the outcome
-
the selection of the reported result.
Each study was classified as having a low, some concerns, or high risk of bias according to the algorithms that incorporated several domain-specific signalling questions. The levels of judgements from all domains were later deduced into an overall risk of bias for each study. Studies were judged to have a low overall risk of bias if all domains presented with low risk. If at least one domain was rated as some concerns, studies were judged as having some concerns. Studies were judged to be at high risk of bias if at least one domain showed high risk, or if there were some concerns in multiple domains that could considerably lower confidence in the study’s results. The results of these assessments were then transferred to a Microsoft Excel 2021 spreadsheet and subsequently uploaded to the Risk of Bias Visualization Tools (ROBVIS) platform, where the results were visually represented by a traffic light system.24
Assessment of publication bias
Publication bias was assessed using visual inspection of funnel plots. Funnel plot analysis was only performed when ≥10 studies were included in the meta-analysis, as recommended by the Cochrane Handbook. All funnel plots are reported in a dedicated section of the results.
Quantitative synthesis
Meta-analysis was conducted in the R software using the ‘meta’ package. All outcomes were assessed as continuous variables with a 95% confidence interval (CI). The mean difference (MD) was calculated using either a fixed-effects model or the DerSimonian–Laird random-effects model. The random-effects model was used when heterogeneity was present (I²>50%). A p-value of less than 0.05 was considered statistically significant in all analyses. A meta-regression analysis was performed for participants and study characteristics that are continuous variables, if they are reported in more than 10 studies, with prespecified covariates of mean age, sample size and male proportion.
Results
Literature search and selection
A thorough search identified a total of 6,491 potentially relevant studies. Subsequent removal of duplicates and irrelevant articles using the database filter narrowed down the selection to 1,903 studies. An assessment of eligibility based on titles and abstracts led to the exclusion of 1,814 studies, resulting in 89 full texts assessed for eligibility, as depicted in Figure 1. We excluded a total of 68 studies: 16 studies due to irrelevant study design, 23 studies due to irrelevant outcome, 19 studies due to irrelevant comparator and 10 studies due to irrelevant indication. This curated subset of 21 studies was selected to be included in our analysis.
Figure 1: The Preferred Reporting Items for Systematic Reviews and Meta-Analyses flowchart
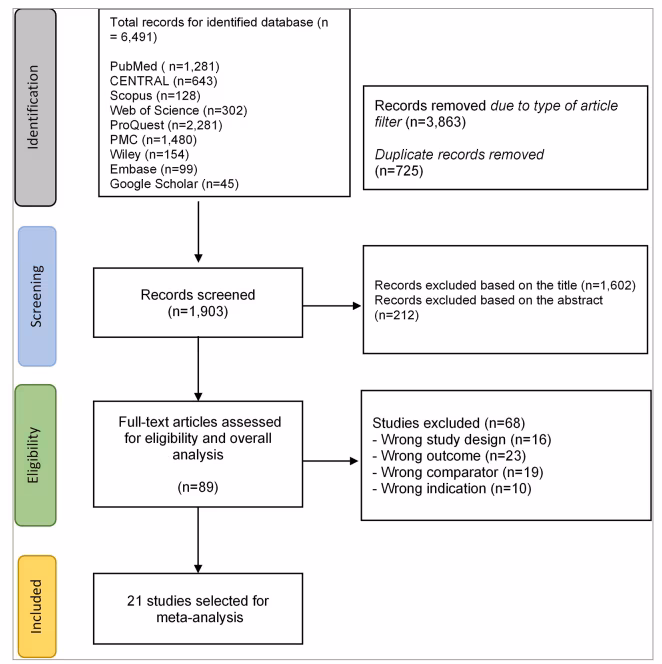
CENTRAL = Cochrane Controlled Register of Trials; PMC = PubMed Central
Characteristics of the included studies
A total of 21 RCTs were included in the analysis, comprising 821 patients with HF from studies conducted across North America, South America, Europe, Asia and Australia. The participants’ mean age was 62.46 ± 9.65 years, with the majority being male. Most patients had a body mass index (BMI) in the overweight or obese range, with a mean BMI of 28.2 ± 4.98 kg/m². The study population included individuals diagnosed with HF, categorized based on LVEF into two groups: preserved and reduced ejection fraction. The average LVEF among participants ranged from 26% to 65%. Additional clinical characteristics of the patients are presented in Table 1.16,17,25–43 Additionally, as summarized in Table 2, 417 patients underwent HIIT, while 404 patients received MICT.16,17,25–43 The most frequently used exercise modalities were cycle ergometry and uphill treadmill walking. The length of interventions varied across studies, ranging from 3.5 to 24 weeks.
Table 1: Baseline characteristics of included studies16,17,25–43
| Author, year | Country | Total patients | Male (%) | Female (%) | Mean age (years) | BMI (kg/m2) | Type of heart failure | LVEF (%) | Medications used by the patients |
| Nechwatal et al., 200225 | Germany | 40 | 37 (92.5) | 3 (7.5) | 46 ± 7 | NA | HFrEF | 28.3 | ACE inhibitors, diuretics, beta-blockers |
| Dimopoulos et al., 200626 | Greece | 24 | 23 (95.83) | 1 (4.17) | 60.5 ± 9.4 | 26.9 ± 4.1 | HFrEF | 32.1 ± 10.6 | NA |
| Roditis et al., 200727 | Greece | 21 | 19 (90.48) | 2 (9.52) | 61.4 ± 8 | 26.7 ± 4.3 | HFrEF | 32.1 ± 10.6 | ACE inhibitors, diuretics, beta-blockers, digitalis, amiodarone, spinorolactone |
| Wisloff et al., 200728 | Norway | 18 | 14 (77.78) | 4 (22.22) | 75.51 ± 10.23 | 24.59 ± 2.91 | HFrEF | 30.26 ± 6.54 | ACE inhibitors, beta-blockers, diuretics, long-acting nitrates, aspirin, statins, warfarin |
| Freyssin et al., 201229 | France | 26 | 13 (50) | 13 (50) | 54 ± 12 | 24.42 ± 4.73 | HFrEF | 29.36 ± 6.6 | Beta-blockers, antiplatelet, diuretics, ACE inhibitors, antiarrhythmic, statins |
| Smart and Steele, 201230 | Australia | 23 | 21 (91.3) | 2 (8.7) | 66 ± 7 | 28.45 ± 4.51 | HFrEF | 28.41 ± 7.49 | Beta-blockers, ACE inhibitors, aspirin, statins |
| Fu et al., 201331 | Taiwan | 30 | 19 (63.33) | 11 (36.67) | 66.9 ± 1.95 | 24.55 | HFrEF | 38.45 ± 4.13 | Diuretics |
| Iellamo et al., 201332 | Italy | 16 | NA | NA | 62.4 ± 8.5 | 27.5 ± 2.5 | HFrEF | 32.6 ± 5.89 | Beta-blockers, ACE inhibitors, diuretics, aldosterone receptor blockers, digoxin, anti-platelet agents, statins |
| Normandin et al., 201333 | Canada | 20 | 18 (90) | 2 (10) | 61 ± 9.9 | 29.9 ± 6.2 | HFrEF | 26 ± 7 | ACE inhibitors, ARBs, beta-blockers, digoxin, furosemide |
| Koufaki et al., 201434 | United Kingdom | 17 | 14 (82.35) | 3 (17.65) | 59.1 ± 8.6 | 29.2 ± 5.1 | HFrEF | 38.4 ± 6.6 | Diuretics, ACE inhibitors, beta-blockers, statins, CCB, nitrates and nitroglycerin |
| Iellamo et al., 201435 | Italy | 36 | 31 (86.11) | 5 (13.89) | 67.8 ± 7 | 28.2 ± 2.52 | HFrEF | 34.85 ± 6.47 | Beta-blockers, ACE inhibitors, diuretics, aldosterone receptor blockers, warfarin, anti-platelet agents, statins |
| Yaylalı et al., 201436 | Turkey | 30 | 26 (86.67) | 4 (13.33) | 61.3 ± 8.4 | 29.4 ± 4.8 | HFrEF | NA | ACE inhibitors, ARBs, beta-blockers, digitalis, nitrates, statins, CCB |
| Aksoy et al., 201537 | Turkey | 30 | 26 (86.67) | 4 (13.33) | 60.2 ± 9.3 | 29.3 ± 4.7 | HFpEF | NA | Aspirin, clopidogrel, ACE inhibitors, angiotensin receptor blockers, CCB, nitrates, coumadin, digitalis, diuretics, beta-blockers, alpha-blockers, statins |
| Angadi et al., 201538 | Canada | 15 | 12 (80) | 3 (20) | 70 ± 8.3 | 29.6 ± 4.21 | HFpEF | NA | NA |
| Benda et al., 201517 | The Netherlands | 20 | 19 (95) | 1 (5) | 65 ± 8 | 28.5 ± 6.11 | HFrEF | 37.5 ± 5.86 | ACE inhibitor, angiotensin II receptor antagonists, aldosterone antagonist, diuretics (loop diuretics), beta-blockers, antiplatelet drugs, coumarin derivatives, statins |
| Ulbrich et al., 201539 | Brazil | 22 | 22 (100) | 0 (0) | 53.8 ± 8 | 28.73 ± 5.1 | HFrEF | 34.24 ± 7.14 | ACE inhibitors, beta-blockers, digitalis, diuretics, nitrates, anticoagulants, antiarrhythmic, statins |
| Ellingsen et al., 201616 | Germany, Belgium, Denmark, Norway, Luxembourg, Italy | 142 | 116 (81.69) | 26 (18.31) | 60 ± 5 | 27.55 ± 5.86 | HFrEF | 28.31 ± 9.31 | ACE inhibitors/ARBs, beta-blockers, aldosterone receptor antagonist, diuretic, digoxin or digitoxin, statin |
| Besnier et al., 201940 | France | 31 | 22 (70.97) | 9 (29.03) | 59.24 ± 12.32 | 26.45 ± 5.15 | HFrEF | 36 ± 7.41 | Beta-blockers, ACE inhibitors, ARBs, diuretics, ARNI |
| Donelli da Silveira et al., 202041 | Brazil | 24 | 12 (50) | 12 (50) | 60 ± 9 | 33.47 ± 5.36 | HFpEF | 65 ± 4.86 | ACE inhibitors, aldosterone receptor antagonist, beta-blockers, diuretics, thiazide, aldosterone blockers, CCB, statins, antiplatelets |
| Mueller et al., 202142 | Germany, Belgium, Norway | 116 | 40 (34.48) | 76 (65.52) | 70 ± 7.48 | 30.55 ± 5.96 | HFpEF | NA | Beta-blockers, ACE inhibitors, diuretics, aldosterone receptor blockers, aldosterone antagonist |
| Papathanasiou et al., 202143 | Bulgaria | 120 | 70 (58.33) | 50 (41.67) | 63.73 ± 6.68 | 27.6 | HFrEF | 35.96 ± 2.15 | NA |
ACE = angiotensin-converting enzyme; ARB = angiotensin II receptor blocker; ARNI = angiotensin receptor–neprilysin inhibitor; BMI = body mass index; CCB = calcium channel blocker; HFpEF = heart failure with preserved ejection fraction; HFrEF = heart failure with reduced ejection fraction; LVEF = left ventricular ejection fraction; NA = not available.
Table 2: Characteristics of high-intensity interval training and moderate-intensity continuous training interventions16,17,25–43
| Author, year | Length (weeks) | High-intensity interval training | Moderate-intensity continuous training | ||||||||
| N | Intervention | Frequency (days/week) | Duration per session (minutes) | Exercise modality | N | Intervention | Frequency (days/week) | Duration per session (minutes) | Exercise modality | ||
| Nechwatal et al., 200225 | 3 | 20 | High-intensity exercise for 15 min at 15 W (30 s exercise and 60 s passive recovery) | 6 | 15 | Cycle ergometer | 20 | Moderate-intensity exercise for 15 min at 75% HRmax | 6 | 15 | Cycle ergometer |
| Dimopoulos et al., 200626 | 12 | 10 | High-intensity exercise for 40 min at 100% baseline pWR (30 s exercise and 30 s passive recovery) | 3 | 40 | Cycle ergometer | 14 | Moderate-intensity exercise for 40 min at 50% baseline pWR | 3 | 40 | Cycle ergometer |
| Roditis et al., 200727 | 12 | 11 | High-intensity exercise for 40 min at 100% baseline pWR (30 s exercise and 30 s passive recovery) | 3 | 40 | Cycle ergometer | 10 | Moderate-intensity exercise for 40 min at 50% baseline pWR | 3 | 40 | Cycle ergometer |
| Wisloff et al., 200728 | 12 | 9 | High-intensity exercise for 4×4 min at 90–95% of HRmax, 3 min active pause at 50–70% HRmax during each interval | 3 | 38 | Uphill treadmill walking | 9 | Moderate-intensity exercise for 47 min at 70–75% HRmax | 3 | 47 | Uphill treadmill walking |
| Freyssin et al., 201229 | 8 | 12 | High-intensity exercise for 12×30 s at 80% maximal power, 60 s passive recovery during each interval | 5 | 33.6 | Cycle ergometer | 14 | Moderate-intensity exercise for 45 min at VT1 | 5 | 60 | Cycle ergometer |
| Smart and Steele, 201230 | 16 | 10 | High-intensity exercise for 60 min at 70% peak VO2 (60 s exercise and 60 s passive recovery) | 3 | 60 | Cycle ergometer | 13 | Moderate-intensity exercise for 30 min at 70% peak VO2 | 3 | 30 | Cycle ergometer |
| Fu et al., 201331 | 12 | 15 | High-intensity exercise for 5×3 min at 80% peak VO2 (80% HRR), 4×3 min active recovery at 40% peak VO2 (40% HRR) | 3 | 36 | Cycle ergometer | 15 | Moderate-intensity exercise for 30 min at 60% of peak VO2 (60% HRR), active recovery at 30% of peak VO2 for 3 min | 3 | 36 | Cycle ergometer |
| Iellamo et al., 201332 | 12 | 8 | High-intensity exercise for 4×4 min at 75–80% HRR, 3×3 min active recovery at 45–50% HRR | 2 days, then increase by 1 day every 3 weeks to 5 days | 48 | Uphill treadmill walking | 8 | Moderate-intensity exercise for 30–45 min at 45–60% HRR | 3 | 65 | Uphill treadmill walking |
| Normandin et al., 201333 | 2 | 10 | High-intensity exercise for 2×8 min at 100% of PPO (30 s exercise and 30 s passive recovery) | 1 | 23 | Cycle ergometer | 10 | Moderate-intensity exercise for 22 min at 60% PPO | 1 | 22 | Cycle ergometer |
| Koufaki et al., 201434 | 24 | 8 | High-intensity exercise for 20×30 s at 50% maximal workload (100% PPO), low-intensity active exercise for 20×1 min at 20–30% PPO | 3 | 30 | Cycle ergometer | 9 | Moderate-intensity exercise for 40 min at 40–60% peak VO2 | 3 | 40 | Cycle ergometer |
| Iellamo et al., 201435 | 12 | 18 | High-intensity exercise for 4×4 min at 75–80% HRR, 3×3 min active recovery at 45–50% HRR | 3 | 45 | Uphill treadmill walking | 18 | Moderate-intensity exercise for 30–45 min at 45–60% HRR | 3 | 45 | Uphill treadmill walking |
| Yaylalı et al., 201436 | 12 | 17 | High-intensity exercise for 30 min at 50–75% HRR (30 s exercise and 30 s passive recovery) | 3 | Cycle ergometer | 13 | Moderate-intensity exercise for 30 min at 50–75% HRR | 3 | 40 | Cycle ergometer | |
| Aksoy et al., 201537 | 10 | 15 | High-intensity exercise for 17×1 min at 50–75% peak VO2, low-intensity active exercise for 30 s at 30 W during each interval | 3 | 35 | Cycle ergometer | 15 | Moderate-intensity exercise for 25 min at 20 W | 3 | 35 | Cycle ergometer |
| Angadi et al., 201538 | 4 | 9 | High-intensity exercise for 4×4 min at 85–90% HRR, 3 min active recovery at 50% HRR during each interval | 3 | 40 | Treadmill | 6 | Moderate-intensity exercise for 30 min at 70% HRR | 3 | 45 | Treadmill |
| Benda et al., 201517 | 12 | 10 | High-intensity exercise for 10×1 min at 90% maximal workload, 10×2.5 min at 30% maximal workload | 2 | 45 | Cycle ergometer | 10 | Moderate-intensity exercise for 30 min at 60–75% maximal workload | 2 | 50 | Cycle ergometer |
| Ulbrich et al., 201539 | 12 | 12 | High-intensity exercise for 4–6×3 min at 95% HRmax, 3 min active recovery at 70% HRmax during each interval | 3 | 60 | Uphill treadmill walking or running | 10 | Moderate-intensity exercise for 30 min at 75% HRmax | 3 | 60 | Uphill treadmill walking or running |
| Ellingsen et al., 201616 | 12 | 77 | High-intensity exercise for 4×4 min at 90–95% HRmax, 3 min active pause at 60–70% HRR during each interval | 3 | 38 | Treadmill or bicycle | 65 | Moderate-intensity exercise for 47 min at 60–70% HRmax | 3 | 47 | Treadmill or bicycle |
| Besnier et al., 201940 | 3.5 | 16 | High-intensity exercise for 2×8 min at 100% PPO (30 s exercise and 30 s passive recovery) | 5 | 30 | Cycle ergometer | 15 | Moderate-intensity exercise for 30 min at 60% PPO | 5 | 40 | Cycle ergometer |
| Donelli da Silveira et al., 202041 | 12 | 12 | High-intensity exercise for 4×4 min at 80–90% peak VO2 (85–95% HRmax) | 3 | 38 | Treadmill | 12 | Moderate-intensity exercise for 47 min at 50–60% peak VO2 (60–70% HRmax) | 3 | 47 | Treadmill |
| Mueller et al., 202142 | 12 | 58 | High-intensity exercise for 4×4 min at 80–90% HRR, 3 min active recovery | 3 | 38 | Cycle ergometer | 58 | Moderate-intensity exercise for 40 min at 35–50% HRR | 5 | 40 | Cycle ergometer |
| Papathanasiou et al., 202143 | 12 | 60 | High-intensity exercise for 3×90% HRmax, moderate-intensity exercise for 2×70% HRmax | 2 | 40 | Upper and lower limbs exercise; flexibility and strength exercise | 60 | Moderate-intensity exercise for 40 min at 70% HRmax | 2 | 40 | Cycle ergometer |
HRmax = maximum heart rate; HRR = heart rate reserve; peak VO2 = peak oxygen uptake; PPO = peak power output; pWR = peak work rate; VT1 = first ventilatory threshold.
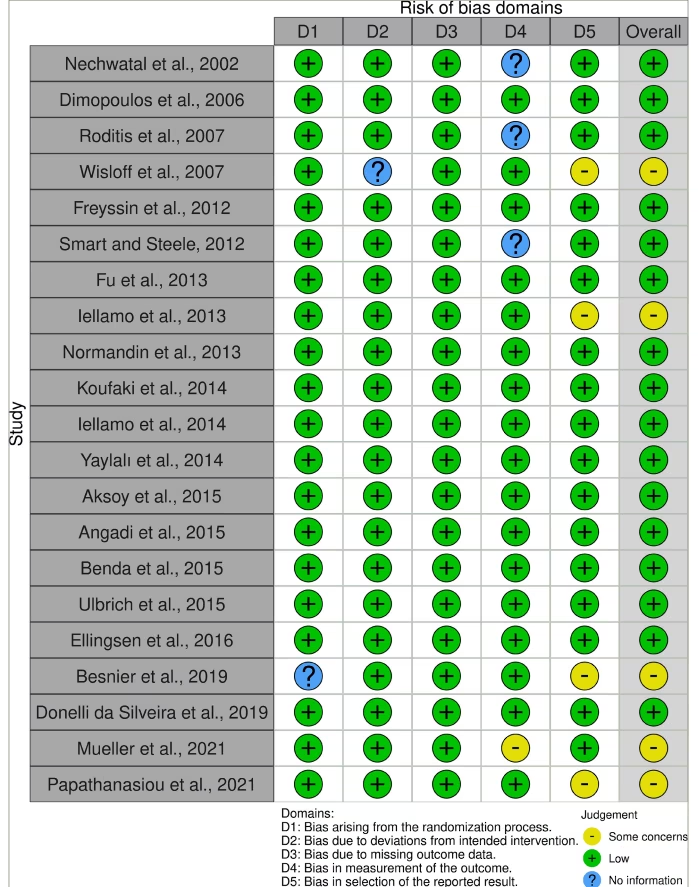
The risk of bias in the included studies was evaluated using RoB 2.0 for the 21 randomized studies, where the results are presented in Figure 2.16,17,25–43 The overall summary shows that 16 studies were at low risk of bias in terms of the randomization process, deviations from intended interventions and missing outcome data, while five other studies showed some concerns regarding the measurement of the outcome and bias in the selection of the reported result.
Figure 2: Traffic-light plot illustrating the risk of bias of the included study according to the Revised Cochrane Risk-Of-Bias Tool for Randomized Trials (RoB 2.0 tool)16,17,25–43
Effectiveness of high-intensity interval training versus moderate-intensity continuous training as complementary heart failure therapy
The comparative clinical outcomes regarding the effectiveness of HIIT compared with the MICT approach are presented in Table 3. Overall, the analysis of the included studies demonstrated favourable results associated with a more favorable effectiveness profile for HIIT.
Quality of life
Across instruments, QoL improved with both HIIT and MICT, and the between-group difference was small and clinically uncertain. This is consistent with the abstract, which does not claim superiority of MICT for QoL. Heterogeneity likely reflects differences in instruments, score directions/scaling and follow-up durations. Accordingly, we interpret QoL as broadly comparable between HIIT and MICT rather than conclusively favouring one modality. The pooled questionnaire-based estimates are shown in Figure 3A.16,17,28–32,34,37,39–43 The instruments employed in the included studies were the Minnesota Living with Heart Failure Questionnaire (MLHFQ; five studies), the Kansas City Cardiomyopathy Questionnaire (KCCQ; three studies) and the MacNew Heart Disease Health-Related Quality of Life Questionnaire (one study). Our analysis demonstrated no significant difference between patients who underwent HIIT and MICT interventions, with an MD of 1.11 (95% CI: -1.02, 3.24; p=0.31), and the p-value revealed that the result is not statistically significant. Heterogeneity was found to be high (I²=81.5%), likely attributable to variability in the types of questionnaires used. Additionally, the funnel plot (Figure 4) also shows a few outliers, indicating the presence of evidence of heterogeneity among the studies. Table 4 presents a summary of the univariate regression findings. The meta-regression analysis revealed a relationship between the number of male participants and effect size, with each unit increase in the number of male participants corresponding to a 2.84-unit increase (p<0.05), indicating a notable impact of the number of male participants on effect size. Age and sample size did not have significant effects.
Figure 3: Forest plots of: (A) quality of life, (B) six-minute walk test and (C) left ventricular ejection fraction16,17,28–32,34,37,39–43
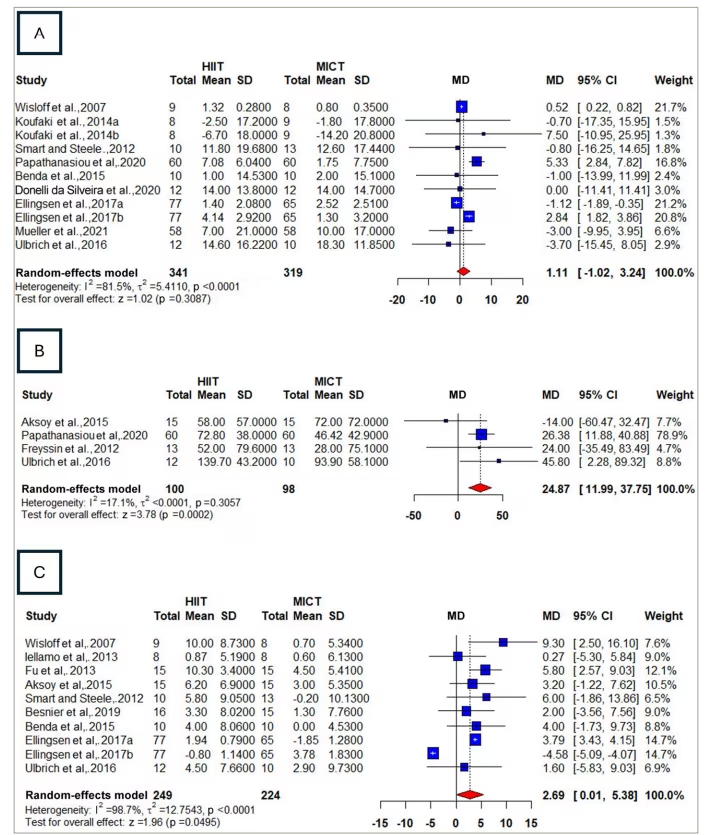
CI = confidence interval; HIIT = high-intensity interval training; MD = mean difference; MICT = moderate-intensity continuous training; SD = standard deviation.
Figure 4: Funnel plot of quality of life
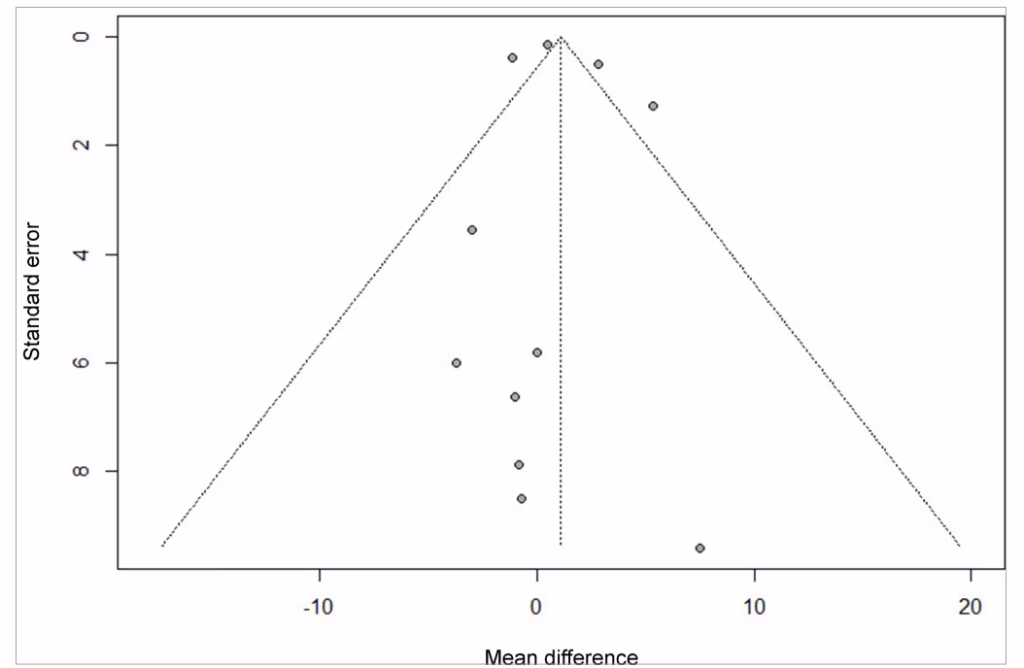
The funnel plot shows few outliers, indicating evidence of true heterogeneity among the studies.
Table 3: Summary of meta-analysis result
| Variables | MD (95% CI) | p-Value | I2 | Favours HIIT | Favours MICT | Non-significant |
| QoL | 1.11 (-1.02, 3.24) | 0.31 | 81.5% | ✔ | ||
| 6MWT | 24.87 (11.99, 37.75) | 0.0002* | 17.1% | ✔ | ||
| LVEF | 2.69 (0.01, 5.38) | 0.0495* | 98.7% | ✔ | ||
| Oxygen pulse | 1.03 (-0.18, 2.24) | 0.095 | 0.0% | ✔ | ||
| Peak VO2 | 1.19 (0.43, 1.95) | 0.0021* | 78.5% | ✔ |
*p<0.05 statistically significant.
CI = confidence interval; HIIT = high-intensity interval training; LVEF = left ventricular ejection fraction; MD = mean difference; MICT = moderate-intensity continuous training; 6MWT = six-minute walk test; peak VO2 = peak oxygen uptake; QoL = quality of life.
Table 4: Meta-regression analysis
| Outcome | Group | Meta-regression | ||
| Estimate | SE | p-Value | ||
| QoL | Age | -3.70 | 6.57 | 0.57 |
| Sample | -3.00 | 3.55 | 0.40 | |
| Male | 2.84 | 0.52 | <0.0001* | |
| Peak VO2 | Age | -0.10 | 1.73 | 0.95 |
| Sample | -0.50 | 1.58 | 0.75 | |
| Male | 0.16 | 0.95 | 0.87 | |
| LVEF | Age | -1.60 | 6.13 | 0.79 |
| Sample | -3.50 | 1.69 | <0.0001* | |
| Male | -4.58 | 0.26 | <0.0001* | |
| 6MWT | Age | 10.81 | 1.69 | 0.57 |
| Sample | 18.28 | 5.50 | 0.47 | |
| Male | 18.11 | 0.93 | 0.53 | |
| Oxygen pulse | Age | -0.31 | 3.16 | 0.49 |
| Sample | 3.15 | 1.06 | 0.06 | |
| Male | 2.38 | 0.33 | 0.05 | |
*p<0.05 statistically significant.
LVEF = left ventricular ejection fraction; 6MWT = six-minute walk test; peak VO2 = peak oxygen uptake; QoL = quality of life; SE = standard error.
Six-minute walk test
Four studies reported 6MWT outcomes, and the results, as seen in Figure 3B, showed that the HIIT group is favourable with an MD of 24.87 (95% CI: 11.99, 37.75; p=0.0002), and the result is statistically significant. Heterogeneity was found to be very low (I2=17.1%). The regression analysis showed no statistically significant associations for mean age, sample size or male gender. These findings suggest that none of the examined factors had a meaningful impact on effect size.
Left ventricular ejection fraction
Ten studies reported LVEF, with Figure 3C showing a favourable trend for the HIIT group, with an MD of 2.69 (95% CI: 0.01, 5.38; p=0.0495), and the p-value revealed that the result is statistically significant. Heterogeneity was found to be very high (I2=98.7%), and the funnel plot also shows a few outliers indicating evidence of true heterogeneity (Figure 5). The regression analysis for LVEF revealed a correlation with the number of male participants, with each unit increase corresponding to 4.58-unit decrease in effect size (p<0.05). The regression also showed a correlation between sample size and effect size, with each unit increase in sample size corresponding to the decrease in effect size by 3.5 units (p<0.05), which is statistically significant. In contrast, mean age was not significantly associated with effect size.
Figure 5: Funnel plot of left ventricular ejection fraction
The funnel plot shows few outliers, indicating the evidence of true heterogeneity.
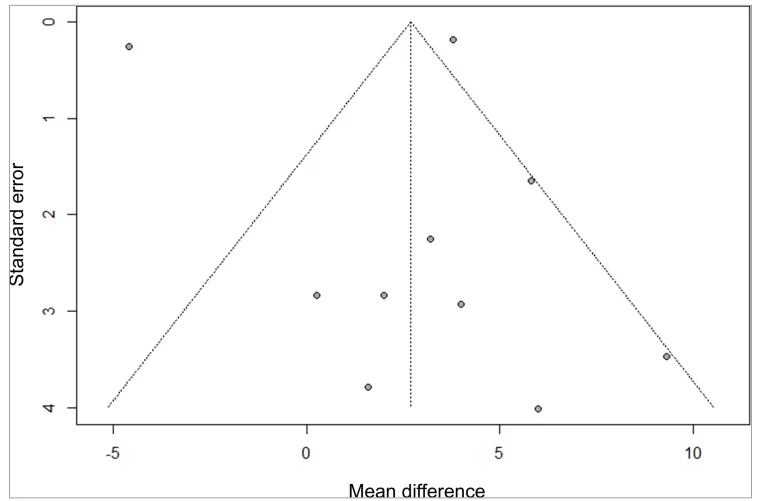
Oxygen pulse
Five studies reported oxygen pulse, and the results, as seen in Figure 6, showed a non-significant trend favouring the HIIT intervention with an MD of 1.03 (95% CI: -0.18, 2.24; p=0.0946).17,29,34,41 Heterogeneity was found to be low (I2=0%). The regression analysis showed a correlation between the number of male participants and effect size, with each unit increase in the number of male participants corresponding to the rise of effect size by 2.38 units (p<0.05), which is statistically significant. The regression analysis showed no statistically significant associations for mean age or sample size.
Figure 6: Forest plot of oxygen pulse17,29,34,41
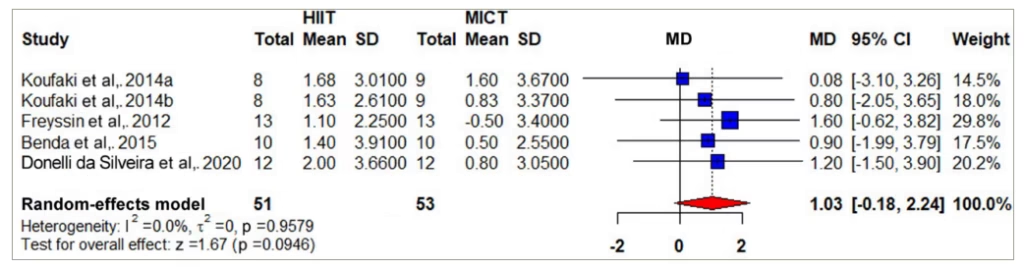
CI = confidence interval; HIIT = high-intensity interval training; MD = mean difference; MICT = moderate-intensity continuous training; SD = standard deviation.
Peak oxygen uptake
Twenty-one studies reported peak VO2, and the results, as seen in Figure 7, showed that the HIIT group was favourable with an MD of 1.19 mL/kg/min (95% CI: 0.43, 1.95; p=0.0021).16,17,25–32,34–37,39–43 Heterogeneity was found to be high (I2=78.5%), and the funnel plot also showed outliers indicating the presence of true heterogeneity among the studies (Figure 8). The regression analysis showed no statistically significant associations for mean age, sample size or male gender.
Figure 7: Forest plot of peak oxygen uptake16,17,25–32,34–37,39–43
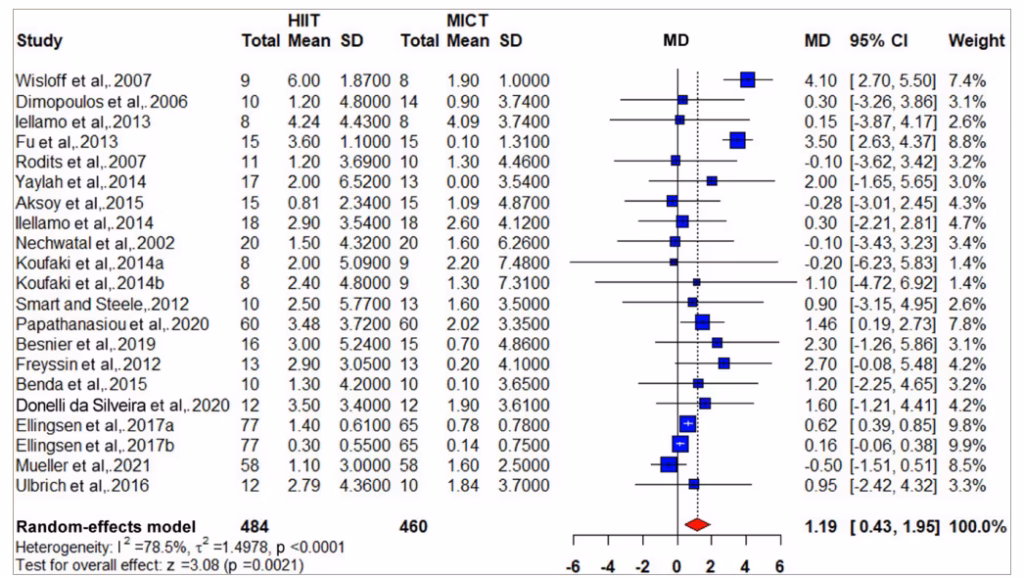
CI = confidence interval; HIIT = high-intensity interval training; MD = mean difference; MICT = moderate-intensity continuous training; SD = standard deviation.
Figure 8: Funnel plot of peak oxygen uptake
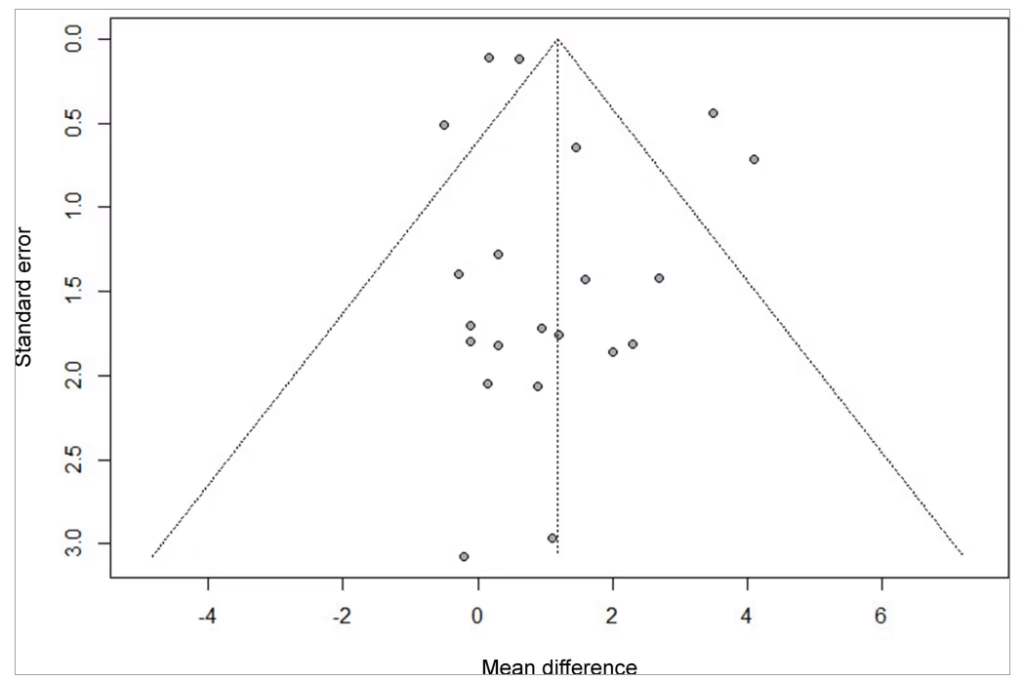
The funnel plot shows outliers, indicating the presence of true heterogeneity among the studies
Discussion
The present meta-analysis showed improvements with both HIIT and MICT; between-group differences in peak VO2 and 6MWT generally favoured HIIT but varied across trials, and LVEF differences were small. Most included participants were New York Heart Association (NYHA) class II–III, which limits generalizability to class I or IV. Within this typical cardiac rehabilitation cohort, both modalities improved functional capacity, and per-class data were insufficient to test NYHA-specific effects. Given the high sarcopenia risk in older populations with HF, exclusive focus on aerobic training may miss a key modifiable driver of frailty and outcomes; integrating progressive resistance training alongside HIIT/MICT is supported by evidence linking sarcopenia with adverse cardiovascular prognosis and by an AHA scientific statement endorsing resistance training (alone or combined with aerobic) for cardiometabolic and functional benefits in patients with and without CVD.44,45 Pandey et al. reported a clear, dose-dependent inverse association between physical activity and incident HF, underscoring the cardioprotective role of regular exercise.46 Complementing this epidemiologic signal, a meta-analysis of 15 RCTs (n=557) by Okamura et al. found that HIIT produced a modest but statistically significant improvement in peak VO2 versus MICT (MD≈1.46 mL/kg/min; 95% CI: 0.39, 2.53; I²≈66%), albeit with very low certainty of evidence and heterogeneity partly moderated by BMI, which shows greater HIIT benefit at lower BMI.47 Furthermore, several meta-analyses also reported significant improvements in both functional outcomes and cardiac parameters with HIIT compared with MICT, which is consistent with our overall findings.19,48 Within this clinical context, modality choice should be individualized: for patients with multiple comorbidities, limited functional reserve or higher intolerance risk, MICT may be the more practical starting option, whereas appropriately supervised HIIT can be considered to maximize gains in cardiorespiratory fitness.49 Moreover, subgroup analysis by Yang et al. further indicated that the benefits of HIIT were more pronounced in younger patients, suggesting that age-related physiological reserve may influence the adaptive response to higher intensity exercise.19,49
Physiological adaptations and clinical implications
HIIT consists of repeated, relatively short bouts of vigorous exercise interspersed with recovery, typically prescribed at ≥90% peak VO2 (or ≥85–95% heart rate reserve, rating of perceived exertion (RPE) 17–19) and >75% of maximal power output, individualized where possible from cardiopulmonary exercise testing.50,51 HIIT induces central and peripheral adaptations that raise exercise capacity and improve metabolic health, including increases in peak VO2, aerobic endurance and anaerobic tolerance.50 Knuiman et al. demonstrated that mitochondrial respiratory states correlate strongly with exercise capacity in HF with reduced ejection fraction (HFrEF); particularly, electron transport system capacity and complex I function together explained >50% of the variance in peak VO2, highlighting mechanistic targets for alleviating exercise limitation.52 Consistent with this, HIIT can augment stroke volume via improved contractility and enhance skeletal-muscle oxygen diffusion, jointly supporting higher aerobic capacity.
HIIT has also been associated with up-regulation of pathways relevant to myocardial recovery after infarction, including Phosphoinositide 3-kinase–Akt (PI3K–Akt) pathway and Mitogen-Activated Protein Kinase (MAPK), which are implicated in cardiomyocyte proliferation and tissue remodelling.53 In a 6-week intervention, Mahjoub et al. observed improved cardiovascular efficiency (resting heart rate 55→51 bpm; systolic blood pressure 121→118 mmHg) with HIIT, although a small decline in right ventricular function (20%→17%) was reported, underscoring the need for careful intensity titration and monitoring in clinical programmes.54 From a clinical standpoint, evaluating HIIT against MICT in HF has direct implications for rehabilitation planning. Both modalities improve functional capacity; modality and dose should be individualized to symptoms, comorbidity and tolerance, with supervision for higher risk patients. Given the heightened risk of sarcopenia in older populations with HF, progressive resistance training on two non-consecutive days per week (large muscle groups, progressive load) should be integrated alongside aerobic training to mitigate frailty and maximize gains in capacity and QoL. Figure 9 outlines complementary physiological pathways that may underpin the observed effects of HIIT and MICT.
Figure 9: Comparative effects of HIIT and MICT on physiological adaptations
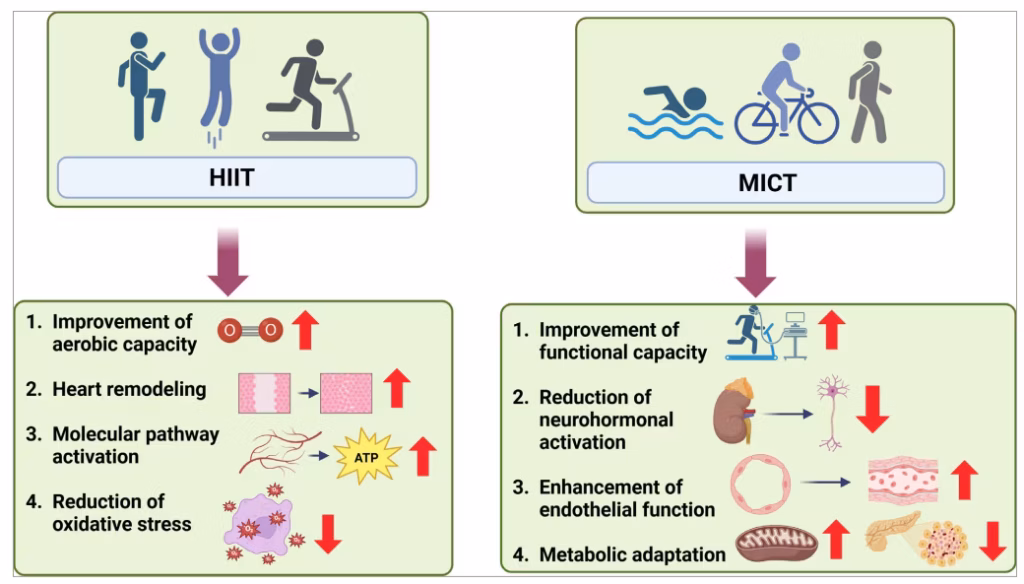
HIIT = high-intensity interval training; MICT = moderate-intensity continuous training.
Strengths and limitations
This meta-analysis integrates clinically meaningful endpoints (peak VO2, 6MWT, LVEF) with a mechanistic framework to show how HIIT and MICT yield benefits via complementary central and peripheral adaptations. We harmonized outcome definitions and units (VO2) and compared modalities in a way that is directly actionable for cardiac rehabilitation, emphasising individualization by phenotype, comorbidity and tolerance. Limitations include substantial between-study heterogeneity (especially for LVEF), small sample sizes in several trials and inconsistent reporting of adherence and adverse events, which constrain safety/tolerability conclusions. Meta-regression used study-level covariates (risk of ecological bias), some change-score variances required imputation, and phenotype-specific effects (acute versus chronic; HFrEF versus HF with preserved ejection fraction; NYHA strata) could not be adequately tested. Protocol differences within ‘HIIT’ and ‘MICT’ (dose, supervision, modality) may have led to exposure misclassification, and publication bias cannot be excluded.
Conclusion
Among patients with HF, HIIT appears to be more effective than MICT in improving functional outcomes, including peak VO2 and 6MWT performance, as well as enhancing cardiac function, reflected by improvements in LVEF. Although both interventions showed comparable effects on QoL and oxygen pulse, the consistent superiority of HIIT across major clinical endpoints suggests that it may be the more effective strategy for cardiac rehabilitation in HF. Nevertheless, MICT may still be a practical option, as its moderate intensity can facilitate better adherence and long-term sustainability. By understanding the comprehensive strategy and the comparative benefits of both exercises, healthcare providers can make decisions adhering to patient compliance and necessity to achieve better outcomes in the management of HF.