Cardiovascular diseases (CVDs) are the leading cause of morbidity and mortality worldwide.1 High systolic blood pressure (SBP) remains one of the top risk factors for CVD burden globally.2 Despite being a modifiable risk factor, hypertension (HTN) remains largely undiagnosed and untreated due to inadequate screening, poor awareness and lack of treatment adherence.3 Globally, HTN is undiagnosed in about 46% of the 1.28 billion adults with HTN, while about 700 million individuals live with uncontrolled HTN.4 These high estimates significantly contribute to premature deaths and disability-adjusted life years lost.3,5 In India, HTN follows global trends and has emerged as a major public health crisis.6 Estimates from national surveys, such as the Longitudinal Aging Study in India (LASI) 2017–2018 and the National Family Health Survey (NFHS-5) 2019–2021, suggest that approximately 30% of Indian adults have HTN, with higher rates in urban areas.6,7 The subnational burden within India is varied due to differences in lifestyle factors, dietary habits, genetic predisposition and environmental factors that contribute to a higher prevalence of HTN and related cardiovascular complications. The awareness, treatment and control rates remain suboptimal – only 50% of hypertensive individuals are aware of their condition, 30% receive treatment and only 10% achieve BP control.8
It has been reiterated that improved blood pressure (BP) screening and monitoring could prevent thousands of deaths attributed to HTN and its associated complications like myocardial infarction, stroke, heart failure and chronic kidney disease.9 The Global Monitoring Framework for Non-communicable Disease (NCD) and the Indian National Health Policy 2017 target 80% of people living with HTN for disease control by 2025.10 With such mandates, the Indian National Programme for Prevention and Control of Non-Communicable Diseases (NP-NCD) aims to improve screening, treatment and registration of HTN to achieve high disease control rates.11 However, limited access to healthcare with geographic inequities makes routine BP screening and monitoring challenging.12 Traditional BP monitoring requires equipment such as a manual or a digital BP monitor, trained personnel and frequent clinical visits, which may not be feasible in resource-constrained settings.13 This critical situation underscores the need for scalable, technology-driven solutions to enhance early detection and long-term BP monitoring.14
With increasing access to smartphones, artificial intelligence (AI)–enabled mobile health (mHealth) applications offer a promising alternative to enhance HTN screening, diagnosis and monitoring. Several AI-enabled applications already demonstrate high accuracy in BP estimation, leveraging principles such as pulse transit time analysis, pulse wave analysis, deep learning and remote photoplethysmography (rPPG).15 The rPPG techniques work by interpreting electrical signals obtained by illuminating capillaries and have shown potential for detecting changes in vasomotor activity and predicting BP levels.16 It also helps in simultaneous monitoring of other cardiovascular parameters like heart rate (HR) and peripheral oxygen saturation (SpO2), along with SBP and diastolic BP (DBP), to provide a holistic view of cardiopulmonary status, helping detect silent hypoxia and cardiovascular stress due to respiratory compromise, with machine learning algorithms potentially improving signal interpretation. Such a comprehensive approach is essential in critical care, chronic disease management and digital health monitoring. It may serve as a useful adjunct in low-resource settings, allowing timely intervention, better clinical outcomes and reduced mortality risk.17
Despite their benefits, these apps are less preferred in routine clinical practice in India and similar resource settings due to safety concerns and factors such as variations in skin tone, hairiness and usability, which can influence rPPG signals.18 There is a gap in evidence that prevents clinicians from using such devices confidently. With this background, the present study was conducted to assess the statistical agreement between app-based and standard clinical measurements of cardiovascular parameters such as SBP, DBP, HR and SpO2 in routine clinical settings.
Methodology
Study design and setting
This cross-sectional study was conducted in August 2024 at the outpatient department (OPD) of the General Medicine Department at an autonomous tertiary care hospital in Bathinda, a district in the Malwa Region, Punjab, a northern state of India. The Malwa region depicts a high burden of non-communicable diseases, including HTN and associated risk factors like obesity and physical inactivity. The institute receives many patients daily who are offered preventive, promotive, curative and palliative services by a group of experts available around the clock.
Study population
Adults aged 18–75 years attending the OPD were included if they had a body weight between 40 kg and 180 kg and height between 120 cm and 200 cm to ensure consistency in physiological measurement validity. Participants provided informed consent after a clear explanation of the study objectives. Exclusion criteria included significant facial obstructions (e.g. excessive facial hair and face coverings), facial skin conditions, scars or tattoos that could interfere with rPPG signal extraction, known CVDs requiring immediate medical intervention, and pregnancy due to potential BP variations.
Sample size calculation and sampling technique
The sample size was estimated a priori based on expected agreement in HTN classification between the app-based and standard methods, using Cohen’s kappa for two raters. This was used as a pragmatic basis for recruitment planning because HTN classification was one of the clinically relevant comparison outcomes. The calculation was performed using an online kappa sample size calculator (https://wnarifin.github.io/ssc/sskappa.html).19 The minimum acceptable kappa was set at 0.70 and the expected kappa at 0.85, assuming an HTN prevalence of 15% among study participants. At a significance level of 95%, power of 80% and an anticipated 5% allowance for missing data, the minimum required sample size was 363 participants. Continuous agreement for BP, HR and SpO2 was subsequently evaluated using correlation, concordance, Bland–Altman analysis and related metrics.
Study protocol
For the present study, app-based and standard measurements were obtained during the same outpatient visit. The pre-existing AI-enabled mobile application used rPPG to estimate cardiovascular parameters. As this manuscript reports a single-center cross-sectional method-comparison study, only the procedures relevant to the current clinical comparison are described here. App-based measurements were obtained using a smartphone (Android: OnePlus Nord 5, OnePlus, Shenzhen, Guangdong, China), an iOS device (iPhone SE, Apple, Cupertino, CA, USA) and a laptop (macOS; MacBook Pro M1, Apple, Cupertino, CA, USA) under ambient lighting conditions, with participants positioned approximately 1 m from the camera (Sony Cybershot DSC-W830, Sony, Tokyo, Japan). Recordings were captured using the front-facing camera at 1,920×1,080 resolution and a fixed frame rate of 30 frames per second. Three 30 s recordings were obtained, and the average of the three readings was used for analysis. The application version used during the study was Version 1.0, and the algorithm was fixed (frozen) prior to data collection, with no updates or modifications during the study period. No participant-specific calibration was performed during the study visit, and participants included in this study were not part of the training data set. Failed or unusable scans (n=5) were repeated during the same visit, and only successful recordings were included in the final analysis. Reference measurements were obtained by a trained healthcare professional, blinded to the app-based readings, using a clinically validated Omron digital BP monitor (Model: Omron HEM-7120, Omrom Healthcare, Muko City, Japan) and a pulse oximeter (Model: Dr. Trust Finger Pulse Oximeter 210, Dr Trust, New York, NY, USA), while app-based measurements were obtained from smartphone-, iOS-, and laptop-based rPPG recordings. Both smartphone- and laptop-based acquisitions were used for data collection, and the outputs were consolidated on the laptop platform for analysis. This study should be interpreted as a method–comparison study rather than a formal regulatory validation study.
Data collection
Upon informed consent, history was taken by medical interns to record sociodemographic and clinical data, including age, gender, skin tone, weight, height, smoking status, history of diabetes or HTN, and factors affecting facial recognition (e.g. facial hair, turbans, makeup and facial creams). Participants were instructed to sit quietly for 5 min before measurements to stabilize BP. Three BP readings were obtained for each participant at 1 min intervals, and three SpO2 readings were also recorded using a standard pulse oximeter. Reference measurements were obtained with a clinically validated Omron digital BP monitor and a standard pulse oximeter, while app-based measurements were obtained from smartphone- and laptop-based rPPG recordings. The order of measurement modalities was randomized at the participant level using a computer-generated sequence to minimize systematic bias. The final participant report generated through the app dashboard included SBP, DBP, HR and SpO2, along with additional parameters not evaluated in the present study, such as respiratory rate, 10-year cardiovascular risk score, wellness score, stress score, body mass index (BMI) classification and personalized health recommendations. The application-generated report used a color-coded system (green/yellow/red) to indicate worsening of the parameters (Figure 1).
Figure 1: Output generated by the mobile app
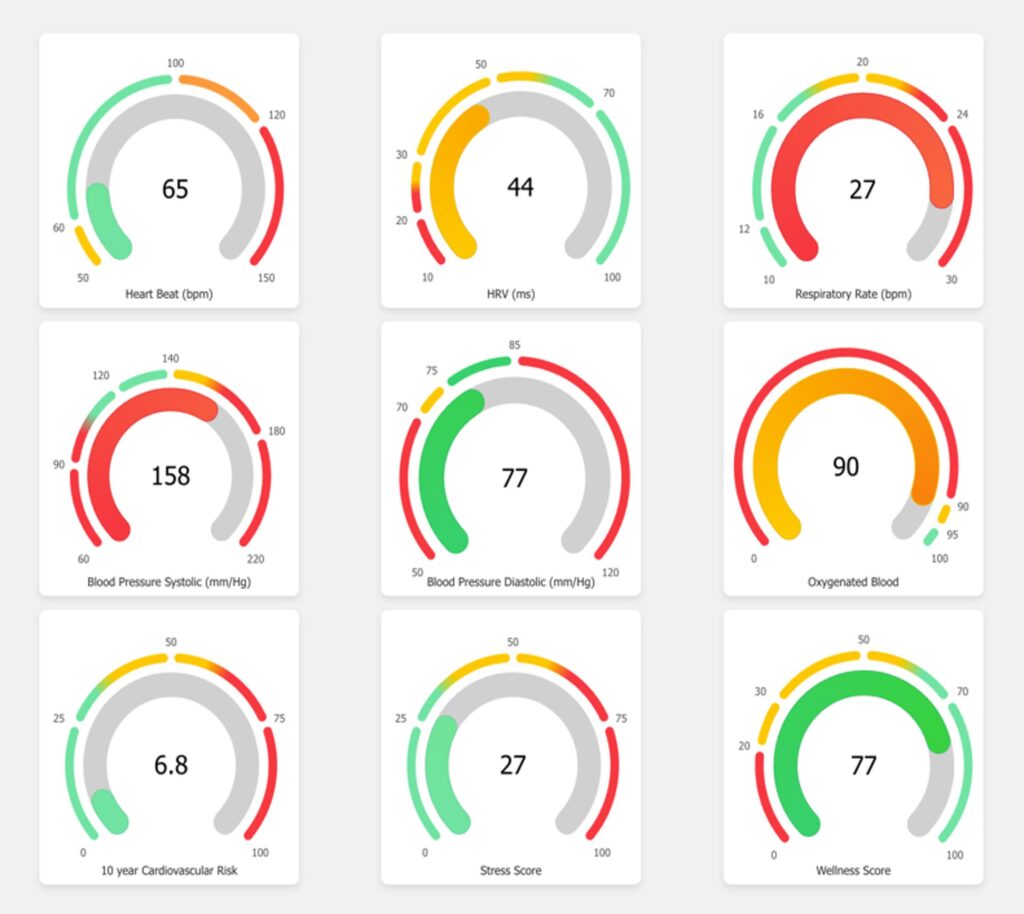
HRV = heart rate variability
Statistical analysis
Data were imported into MS Excel (Microsoft, Redmond, WA, USA). No missing data or unusable app-based recordings requiring exclusion were observed, as any incomplete or unusable recordings were repeated during the same visit. The mean of three BP readings from the app and the Omron digital BP monitor was analyzed. To compare paired continuous measurements between the two methods, a paired t-test was used. The Pearson correlation coefficient was used to assess the linear relationship between rPPG-based and standard BP readings. Agreement between methods was evaluated using a Bland–Altman analysis to assess bias and the limits of agreement (LOA). The intraclass correlation coefficient was calculated to assess measurement consistency. Mean bias of difference with standard deviation, weighted kappa, Lin’s concordance correlation coefficient (CCC) and root mean square error (RMSE) were also computed to assess agreement and measurement error. Sensitivity, specificity, positive predictive value (PPV) and negative predictive value (NPV) were calculated to assess the AI model’s diagnostic performance in identifying HTN. The receiver operating characteristic (ROC) curve was used to evaluate the AI-based application’s discriminatory ability by estimating the area under the curve (AUC) for HTN classification. Subgroup analyses were performed by skin tone, hidden facial features, age group, BMI category and HTN status. Correlation coefficients were interpreted using standard thresholds, with values of 0.40–0.59 considered moderate. Lin’s CCC values were interpreted as poor when <0.90, moderate when 0.90–0.95, substantial when 0.95–0.99 and almost perfect when >0.99.20,21 All the analyses were done using Statistical Package for the Social Sciences (SPSS-IBM SPSS Statistics for Mac, Version 29.0.2, IBM Corp., Armonk, NY, USA)
Ethics statement
This study was conducted in accordance with the ethical principles of the Declaration of Helsinki and Good Clinical Practice guidelines. Ethical approval was obtained from the Institutional Ethics Committee, AIIMS Bathinda (IEC/AIIMS/BTI/07/15, dated July 27, 2024), before initiation of data collection. Written informed consent was obtained from all participants after explaining the study objectives, procedures, potential risks and benefits, including the use of app-based facial video capture for estimation of cardiovascular parameters. Participants were informed of their right to withdraw from the study at any time without affecting their clinical care. Facial recordings obtained during the study were used solely for the extraction of physiological signals and parameter estimation. Facial recordings were temporarily processed and stored on secure password-protected systems accessible only to authorized study personnel. No directly identifiable information was included in the analytic data set. Access to study data was restricted to the authorized research team, and all stored data were handled using password-protected systems in accordance with applicable institutional and national data-protection requirements. The study received no internal or external funding. Medista.ai developed the mobile application evaluated in this study; however, the developer-affiliated authors had no role in study design, reference-standard measurements, or statistical analysis.
Results
Table 1 summarizes the demographic and clinical characteristics of the 366 study participants. The largest age group was 31–45 years (32.0%), followed by 46–60 years (29.0%), 18–30 years (26.8%) and >60 years (12.3%). Males comprised 59.8% of the sample, while females comprised 40.2%. A higher proportion of our study participants were living with overweight or obesity (70.2%). About 3.0% were smokers, 9.6% were living with diabetes, and 26.5% had a known history of HTN. Facial features were hidden in 19.7% of participants. Skin tone distribution showed that 83.9% had a light to medium brown complexion, 13.1% had a dark to very dark brown tone, and 3.0% had a very light beige tone.
Table 1: Participant characteristics
|
| Count | Column N% |
| Total | 366 | 100.0 |
| Age-group (completed years) |
|
|
| 18–30 | 98 | 26.8 |
| 31–45 | 117 | 32.0 |
| 46–60 | 106 | 29.0 |
| >60 | 45 | 12.3 |
| Gender |
|
|
| Male | 219 | 59.8 |
| Female | 147 | 40.2 |
| Body mass index |
|
|
| Underweight | 11 | 3.0 |
| Normal | 101 | 27.6 |
| Overweight | 60 | 16.4 |
| Obese | 194 | 53.0 |
| History of |
|
|
| Smoking | 11 | 3.0 |
| Diabetes | 35 | 9.6 |
| Hypertension | 97 | 26.5 |
| Facial features hidden |
|
|
| No | 294 | 80.3 |
| Yes | 72 | 19.7 |
| Skin tone |
|
|
| Dark to very dark brown | 48 | 13.1 |
| Light to medium brown | 307 | 83.9 |
| Very light beige | 11 | 3.0 |
Table 2 compares the parameters recorded using an AI-based application with those recorded using standard methods. HR, SBP and DBP readings were comparable between the two methods, with no statistically significant differences observed. In contrast, SpO2 showed a small but statistically significant difference between the app-based and standard measurements. The AI-based application also classified a significantly higher proportion of participants as hypertensive than the standard method.
Table 2: Comparison of variables measured by AI-based mobile phone application versus standard method
| Variable | AI-based application | Standard method | p-value‡ |
| Heart rate (bpm)* | 83.44 (16.68) | 83.55 (16.03) | 0.599 |
| SBP (mmHg)* | 128.72 (20.70) | 129.10 (18.43) | 0.412 |
| DBP (mmHg)* | 80.84 (12.78) | 80.51 (11.83) | 0.236 |
| Oxygen saturation (SpO2 %)* | 96.08 (2.67) | 96.45 (2.28) | <0.001 |
| Hypertensive (SBP ≥140 mmHg and/or DBP ≥90 mmHg)† | 37.98 (33.13–43.08) | 32.24 (27.64–37.21) | 0.001 |
Comparison of heart rate, blood pressure and oxygen saturation measured by artificial intelligence-based mobile phone application versus standard method (n=366)
*Mean (standard deviation).
†Percentage (95% confidence interval).
‡Calculated using paired t-test or McNemar’s test.
AI = artificial intelligence; DBP = diastolic blood pressure; SBP = systolic blood pressure.
The Bland–Altman plots depict the agreement, mean bias, and limits of agreement between the AI application and standard methods for HR, SBP, DBP, and SpO₂ (Figure 2) .The correlation and concordance plots (Figure 3A–D) graphically depict the relationship between the AI application and standard methods. The HR, SBP and DBP exhibited a very strong positive correlation and high-to-substantial Lin’s concordance coefficients (Table 3), indicating that the AI tool’s readings were similar to those of standard methods. However, SpO2 showed a moderate correlation and poor concordance. Weighted kappa statistics showed strong, moderate and poor agreement for HR (0.82), SBP (0.70), DBP (0.71) and SpO2 (0.30), respectively. The RMSE values were 4.01 bpm for HR, 8.87 mmHg for SBP, 5.32 mmHg for DBP and 1.77% for SpO2. Subgroup analysis using skin tone, hidden facial features, age-group, BMI categories and HTN status revealed comparable mean bias (SD) of difference, LOA, weighted kappa, Lin’s CCC and RMSE for all variables except for very light beige skin color and underweight participants (Tables S1-S4).
Figure 2: Bland–Altman plot
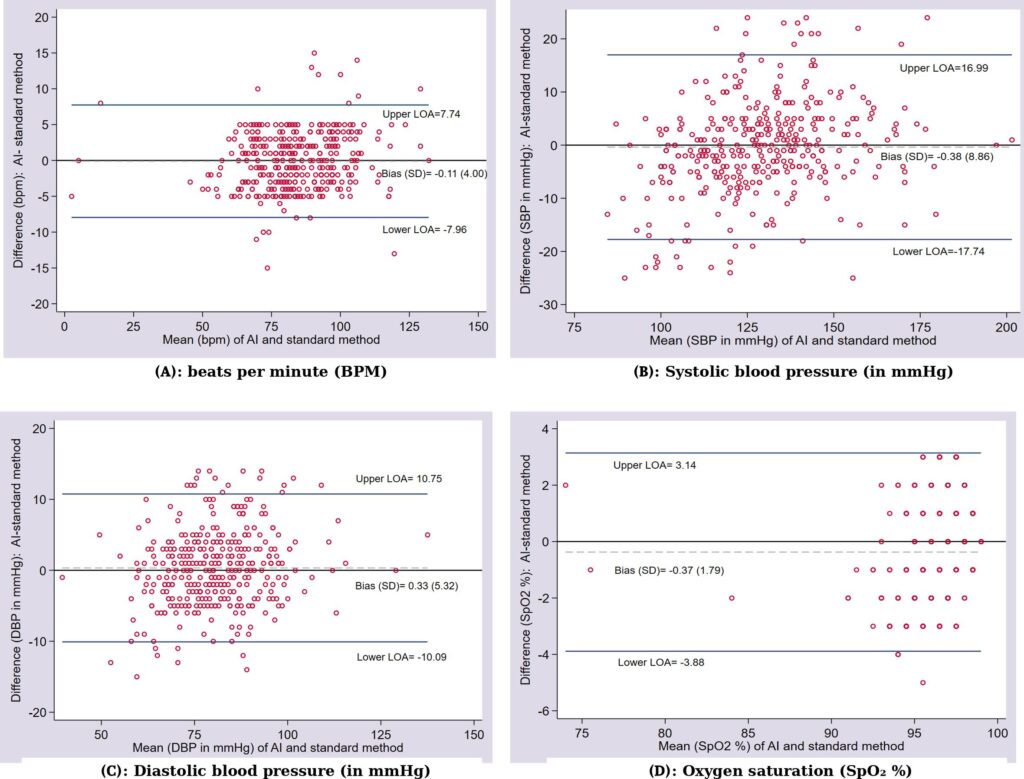
Bland–Altman plot depicting agreement in (A) heart rate, (B) systolic blood pressure, (C) diastolic blood pressure and (D) oxygen saturation assessed by AI versus standard method
AI = artificial intelligence; BPM = beats per minute; DBP = dystolic blood pressure; LOA = limits of agreement; SD = standard deviation; SBP = systolic blood pressure.
Figure 3: Correlation and concordance plots for variables measured by AI-based application versus standard method
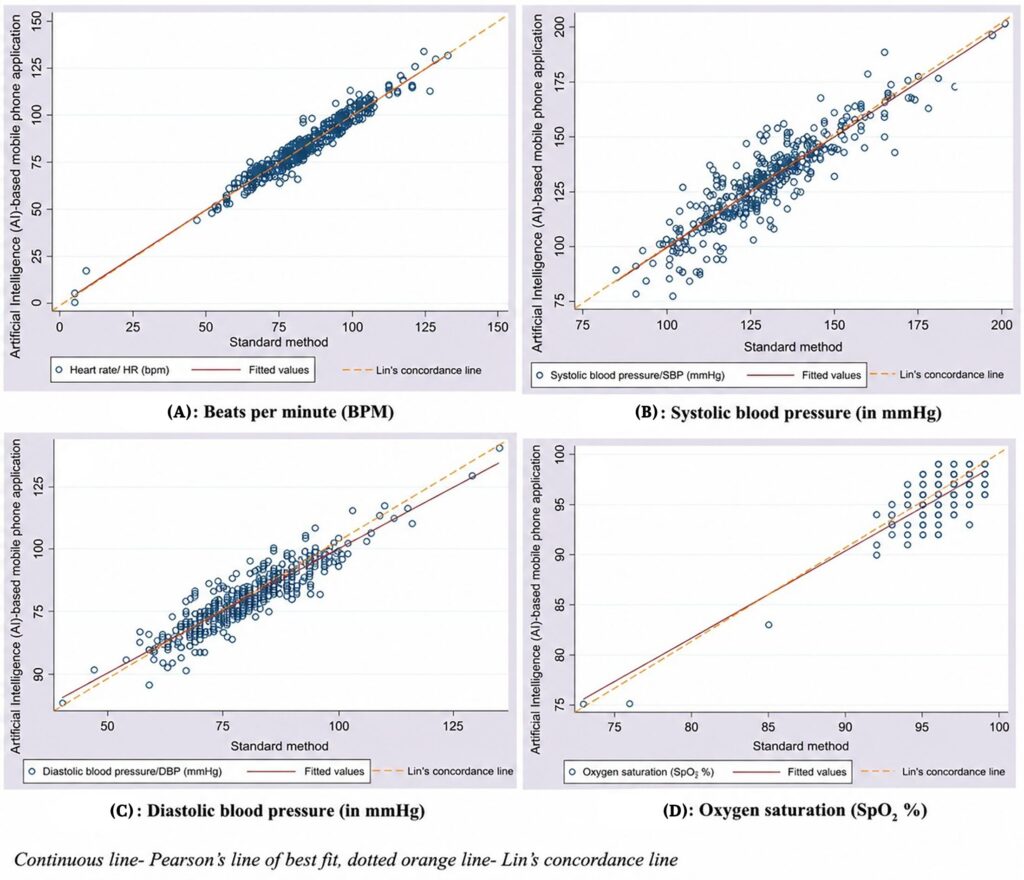
Correlation and concordance plot for (A) heart rate, (B) systolic blood pressure, (C) diastolic blood pressure, (D) SpO2 between an AI-based mobile phone application versus the standard method
AI = artificial intelligence; BPM = beats per minute; DBP = diastolic blood pressure; HR = heart rate; SBP = systolic blood pressure
Table 3: Mean bias (SD) of difference, limits of agreement, ICC, Kappa, Lin’s CCC and RMSE determined by AI-based mobile phone application versus standard method
| Variable | Mean bias of difference (SD) | Lower limit of agreement | Upper limit of agreement | ICC | Weighted kappa (95% CI) | Lin’s CCC (95% CI) | RMSE |
| Heart rate (bpm) | -0.11 (4.00) | -7.96 | 7.74 | 0.96* | 0.82 (0.80–0.84)* | 0.97 (0.96–0.98)* | 4.01 |
| Systolic blood pressure (mmHg) | -0.38 (8.86) | -17.74 | 16.99 | 0.90* | 0.70 (0.67–0.74)* | 0.90 (0.88–0.92)* | 8.87 |
| Diastolic blood pressure (mmHg) | 0.33 (5.32) | -10.09 | 10.75 | 0.90* | 0.71 (0.67–0.75)* | 0.91 (0.89–0.92)* | 5.32 |
| Oxygen saturation (SpO2) | -0.37 (1.79) | -3.88 | 3.14 | 0.49* | 0.30 (0.23–0.36)* | 0.73 (0.69–0.78)* | 1.77 |
Mean bias (SD) of difference, limits of agreement, intraclass correlation, kappa, Lin’s concordance correlation coefficient and root mean square error determined by artificial intelligence-based mobile phone application versus standard method
*p-value<0.001.
AI = artificial intelligence; CCC = concordance correlation coefficient; CI = confidence interval; ICC = intraclass correlation; RMSE = root mean square error; SD = standard deviation.
Overall, the AI-based app showed a sensitivity of 92.37% (95% CI: 89.65, 95.09), a specificity of 87.90% (95% CI: 84.56, 91.24), a PPV of 78.42% (95% CI: 74.20, 82.63) and an NPV of 96.04% (95% CI: 94.04, 98.03) in diagnosing HTN compared with the standard method (Supplementary Tables S5 and S6). The ROC curve analysis showed good discriminatory ability for HTN classification. However, SBP (AUC=0.93) was slightly better than DBP (AUC=0.88; Figure 4).
Figure 4: Receiver operating characteristic curve depicting the discriminatory power of an AI-based mobile phone application in participants with or without hypertension
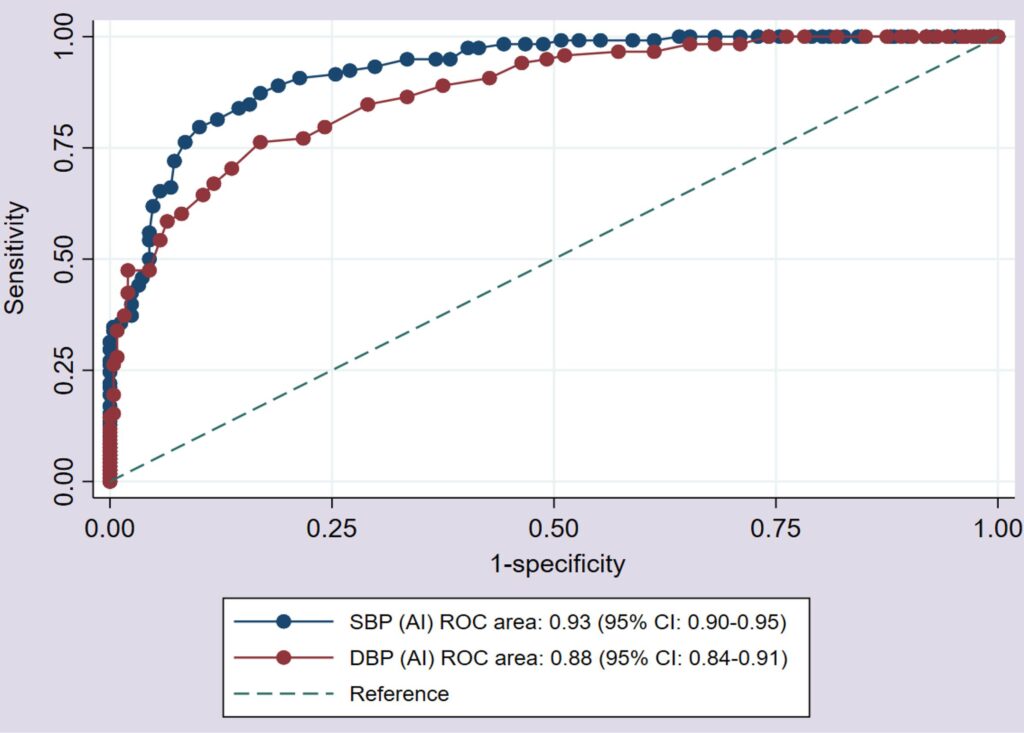
AI = artificial intelligence; CI = confidence interval; DBP = diastolic blood pressure; ROC = receiver operating characteristic curve; SBP = systolic blood pressure.
Discussion
Monitoring BP remains an important but often difficult component of long-term HTN care, particularly in settings where access to repeated measurement, trained personnel or regular follow-up is limited. AI-enabled cuffless BP monitoring is a rapidly evolving, clinically relevant field that may offer a practical adjunct to standard approaches in such contexts. In the present study, we compared the app-based measurements with standard methods under controlled outpatient conditions and observed three key findings. First, the AI-based mobile application produced HR, SBP and DBP measurements that were broadly comparable to those obtained using the standard method. However, SpO2 showed a small but statistically significant difference between the app-based and standard measurements. Second, the AI-based application and the reference-standard methods demonstrated encouraging agreement for HR and BP under study conditions; however, these findings should not be interpreted as equivalent to formal device validation under the Association for the Advancement of Medical Instrumentation/European Society of Hypertension/International Organization for Standardization (AAMI/ESH/ISO)-type protocols. Third, the application showed good diagnostic performance for HTN classification, whereas SpO2 measurement demonstrated greater variability and weaker agreement, underscoring the need for further refinement before considering clinical use. Numerous studies have explored smartphone-based measurement of vital hemodynamic parameters using device-integrated optical sensors and related signal-processing approaches.22,23
Our findings indicate encouraging agreement between the AI-based application and standard measurements for HR and BP, suggesting potential utility as a screening-support tool rather than evidence of clinical interchangeability. While we are motivated by our results, previous studies suggest that the precision of smartphone-based BP measurement apps varies, with some reporting acceptable accuracy and others highlighting significant discrepancies.24,25 Plante et al. assessed the accuracy of the Instant Blood Pressure app and found that its BP measurements were highly inaccurate, with low sensitivity for hypertensive readings. Approximately 77.5% of individuals with hypertensive BP levels were falsely reassured that their BP was in the non-hypertensive range.26 Another study evaluated the OptiBP™ smartphone application. It demonstrated acceptable accuracy in estimating BP across diverse settings in Bangladesh, South Africa and Tanzania. However, it emphasized the need for further validation studies using specific protocols to assess the clinical accuracy of cuffless BP-measuring devices.27 Such incidents suggest that regular calibration against validated, cuff-based monitors is essential to ensure reliable measurements. Despite these concerns, smartphone-based approaches offer a non-invasive, accessible alternative to traditional medical devices for monitoring vital signs in areas where human resources or calibrated instruments are limited.28,29
The AI application evaluated in this study was based on rPPG, which has gained attention for its potential in non-invasive BP monitoring. The technology has been successfully used in various commercially available therapeutic devices to measure BP, SpO2 and cardiac output, as well as to evaluate autonomic function. These applications use optical sensors, commonly found in smartphones, to detect changes in blood volume and estimate BP. Camera-based approaches detect inaccessible rPPG signals, enabling non-invasive BP estimation.30 However, the accuracy and reliability of these apps vary across different studies. A study in Israel tested a PPG-based app and found high BP measurement accuracy compared with traditional cuff-based methods.
Importantly, the study also concluded that factors such as sex, BMI and skin color did not significantly influence the accuracy of the PPG-based measurements.31 Samimi et al. also suggested that PPG morphology features could replace the calibration stage, yielding a calibration-free method with similar accuracy and enabling highly accurate estimates of both SBP and DBP.32 However, another study from Belgium identified a differential and proportional bias in PPG-based BP measurements, noting that SBP tends to be overestimated, while DBP is underestimated.16 It has also been observed that while PPG signals correlate with BP, they may not be sufficient for accurate BP prediction, underscoring the need for further investigation into their limitations.33
Nevertheless, the readings from the application used in our study demonstrated strong positive correlations with standard measurements, and the findings were consistent with existing literature.15,34 Several studies have reported encouraging performance of AI-driven technologies, including those employing rPPG, thereby providing context for interpreting our findings.17,35 However, the lack of standardization and regulatory approval from bodies like the US Food and Drug Administration (FDA) and the European Medicines Agency raises concerns about the clinical validity and reproducibility of such apps in diverse populations. Recent recommendations from the European Society of Hypertension emphasize that cuffless BP devices require dedicated validation pathways distinct from those for conventional cuff-based devices, and encouraging agreement in a method–comparison study should not be interpreted as sufficient evidence for routine clinical use.36 Clinically focused reviews have similarly noted that the wider adoption of cuffless BP technologies depends on rigorous validation, transparency in calibration, reproducibility and appropriate regulatory oversight.37 Without rigorous validation and regular recalibration, PPG-based BP monitoring apps risk misleading users, potentially delaying necessary medical interventions and creating false reassurance. However, a hospital-based study from the Netherlands evaluated the PPG-based algorithm and reported that the device met the AAMI/ESH/ISO Universal Standard requirements and recommended its use for BP monitoring.38 Another study assessed a PPG to track BP changes in healthy adults during different activities and also showed promising results in meeting the acceptance criteria of ISO 81060-3:2022.39 An Indian study combined PPG signal-based and HR variability and also demonstrated a significant correlation between the PPG-based system and standard BP measurements, suggesting its potential for BP monitoring in clinical settings.40 Previous BP estimation applications have shown variable performance across studies, with differences in populations, devices, signal-processing methods, calibration requirements and evaluation frameworks.41 Therefore, direct comparison of absolute performance estimates across studies should be interpreted cautiously.42 In our study, the observed mean bias for SBP and DBP was low; however, the broader LOA indicate that these findings should be interpreted as encouraging method–comparison results rather than evidence that the application outperforms previous methods.22
However, SpO2 showed weaker performance than HR and BP in our study, with only moderate correlation and poorer concordance. A similar study, however, demonstrated high accuracy in measuring SpO2, with mean absolute errors as low as 1.1%.22 Previous literature has raised concerns about discrepancies in SpO2 measurements, which may be attributed to inherent challenges in accurately measuring SpO2 with mobile applications, thereby affecting accuracy and reliability.18,43 Variations in skin tone, due to differential amounts of melanin, which significantly absorbs light, lead to an underestimation of SpO2 in individuals with darker skin tones.44 Additionally, motion artifacts introduce noise in the PPG signal, reducing reliability, especially in mobile and wearable devices.45 Also, environmental light can further compromise readings, as external light sources may distort the signal, necessitating advanced filtering algorithms.46 Furthermore, poor perfusion negatively affects the PPG signals.37 Other factors, such as the quality of the device and its sensors, suboptimal selection of red and infrared wavelengths, choice of measurement sites with varying blood flow dynamics, underlying health conditions and the presence of diseases such as anemia or peripheral vascular disease, can distort the readings.46 Improvements in hardware, signal processing algorithms and clinical validation can help overcome such challenges.
This study has several strengths and limitations. The strengths include a clinically relevant research question, conducted in a real-world outpatient setting, a reasonable single-center sample size, the use of repeated measurements with validated reference devices and application of agreement-based statistical methods rather than reliance on correlation alone. The study also attempted to examine performance across clinically relevant participant characteristics, including skin tone and facial feature obstruction. The limitations should be interpreted carefully. As this was a single-center study, the findings may not be generalizable to other settings and populations. Older adults, underweight participants and those at the extremes of skin tone (dark to very dark brown and very light beige) were represented by small numbers; therefore, subgroup-specific estimates for these clinically important groups should be interpreted cautiously, even though exploratory subgroup analyses were performed. In addition, the cross-sectional design does not allow assessment of longitudinal repeatability, clinical outcomes or patient engagement over time. Although the app showed encouraging agreement for BP and HR under study conditions, the findings should not be interpreted as evidence of formal device validation or clinical interchangeability with standard methods. Importantly, SpO2 showed weaker performance, with only moderate correlation and poorer concordance than the other parameters; therefore, these results should be viewed as preliminary and insufficient to support strong conclusions regarding routine clinical use for SpO2 measurement. Last, although five app-based scans required repetition, subgroup-wise repeat burden by skin tone, facial obstruction, age group or BMI was not prospectively recorded and could not be evaluated.
That said, our study’s findings carry important public health implications. AI-based applications may have a future role in addressing gaps in HTN screening and remote monitoring, particularly in settings where shortages of trained personnel or limited access to follow-up constrain repeated standard measurements. Our results suggest that such tools support home- or facility-based preliminary screening and improve patient engagement in self-monitoring. However, abnormal readings should still be confirmed using validated standard methods before clinical decision-making. They may also contribute to the broader digital health ecosystem envisaged under initiatives such as the Ayushman Bharat Digital Mission in India. At the same time, these potential benefits should be interpreted cautiously. In our study, the AI-based application classified a somewhat higher proportion of participants as hypertensive than the reference method. This higher rate of HTN classification by the AI-based application may have practical implications in screening settings, including unnecessary confirmatory evaluations, increased patient anxiety and possible inappropriate treatment escalation if app-based readings are used in isolation. Accordingly, abnormal app-based BP readings should be interpreted as preliminary screening results and confirmed using validated standard methods before clinical decision-making. In addition, the performance of AI-based applications may be influenced by device quality, image acquisition conditions and signal-processing limitations. Thus, while the technology is promising, further multicenter studies, longitudinal validation and adherence to regulatory–standard evaluation frameworks are necessary before wider clinical implementation can be considered.
In conclusion, the present study showed encouraging agreement between the AI-based mobile phone application and standard methods for HR and BP measurement among adults in North India. These findings support its potential as a screening-support tool for remote and home-based monitoring, pending further multicenter, protocol-based validation. However, SpO2 performance was less consistent and should be regarded as preliminary, requiring further refinement before clinical use. As digital health technologies continue to evolve, such tools may become useful adjuncts to conventional monitoring. However, successful implementation will depend on transparency, validation, data security, bias mitigation and appropriate regulatory oversight. Future research should focus on refining the application, validating its performance across diverse populations and settings and examining its impact on clinical and public health outcomes.