Ventricular fibrillation (VF) is characterized by rapid (>300 beats a per minute), irregular electrical activation with variable electrocardiographic waveforms that prevents coordinated myocardial contraction, resulting in immediate loss of cardiac output.1 It most commonly occurs in the context of coronary artery disease.2,3
Resuscitation efforts are critically time-dependent: with each minute of untreated VF, the survival rate declines by approximately 6–10%, and real-world estimates place the time to first defibrillation in the pre-hospital setting between 4 and 10 min.4–9 Yet, little is known about the mechanisms sustaining VF at these clinically relevant time points. While early (short-duration) VF has been studied during brief interruptions of coronary perfusion in humans, the arrhythmia encountered during resuscitation typically represents a metabolically more compromised and evolved state that remains poorly characterized.10,11
Direct investigation of sustained VF in humans is fundamentally constrained by ethical considerations, and current mechanistic understanding is therefore largely derived from animal models and ex vivo human hearts. However, differences in species, substrates and experimental as well as methodological approaches have produced divergent findings that sustain an ongoing controversy regarding the dominant mechanisms responsible for VF maintenance.
At the centre of this debate lies a historical but fundamental question: Is VF sustained by a largely anarchic, disorganized process of continuously fragmenting wavelets, or does it exhibit hierarchical organization maintained by discrete electrical drivers such as re-entrant circuits or focal sources? Evidence suggests that this dichotomy may be overly simplistic.12 Rather than representing mutually exclusive mechanisms, organized and disorganized patterns may co-exist within the same episode of VF, with their relative contributions evolving over time and being shaped by the metabolic state, underlying myocardial structure and the intrinsic properties of the Purkinje system.12–15
In this article, we summarize the experimental evidence and proposed mechanistic concepts underlying sustained VF. We discuss the ethical, translational and technical challenges inherent to in vivo VF research and how these limitations influence mechanistic interpretation. We then examine data from short-duration VF (SDVF) in humans and long-duration VF (LDVF) in large animal or ex vivo models and the on-going controversies regarding VF maintenance. Emphasis is placed on the temporal evolution of VF, the role of the Purkinje system during prolonged ischaemia and the still only sparsely explored impact of structural remodelling on fibrillatory dynamics. Finally, we identify gaps in knowledge and outline future directions, highlighting the need for true 3D mapping and multimodal structure–function integration to enable mechanistic phenotyping of VF and improve clinical translation.
Methodological and translational challenges in sustained ventricular fibrillation research
Mechanistic investigations of sustained VF present unique ethical, translational and technical challenges that fundamentally shape both the available evidence and its interpretation.
Ethical constraints in human ventricular fibrillation research
In vivo studies of sustained VF in humans would be unethical. VF cannot be intentionally induced and maintained for prolonged periods of time, as encountered during cardiac arrest, primarily due to the high ischaemic vulnerability of the brain.16 Consequently, available human data are largely limited to short episodes of VF studied during transient supra-coronary aortic occlusion in intraoperative settings or during invasive electrophysiological studies with VF induction.10,17 Reported durations typically range from a few seconds to less than 1 minute with rare extensions to approximately 2 minutes.10,11,17
While these brief episodes have provided valuable insights into early VF dynamics, they are insufficient to characterize LDVF, during which progressive metabolic derangement and ionic imbalance fundamentally alter electrophysiological behaviour.18,19 Importantly, mechanisms such as Purkinje-mediated activity and site-specific electrophysiological behaviour secondary to differential ischaemia resistance are thought to become increasingly prominent only after several minutes of untreated VF.20 Thus, human studies so far have captured only a narrow temporal window of a much more complex and dynamically evolving arrhythmia.
Alternative approaches, such as VF mapping with veno-arterial extracorporeal membrane oxygenation, have enabled longer VF recordings under ethically acceptable conditions.21 However, in these settings the myocardium remains perfused via retrograde coronary flow, and therefore does not reproduce the profound global ischaemia characteristic of true cardiac arrest. As a result, VF dynamics observed may differ substantially from those occurring during arrest, limiting their generalizability.
Translational considerations of ventricular fibrillation animal models
Given these restrictions, most of the mechanistic insight into sustained VF is derived from animal models. Interpretation of VF dynamics needs to take the underlying anatomical and electrophysiological properties of the selected model into account, whereas the translational value for humans will depend on their similarity to the human heart. Supplementary Table S1 summarizes electrophysiological properties of large animal models used in VF research in comparison with humans.22–39
Most large animal VF research has been performed in dogs and pigs. Canine hearts are considered favourable for ventricular arrhythmia studies due to similarities in ventricular electrophysiological properties and Purkinje network architecture to humans.31,32 However, substantial inter-breed variability in heart size and the presence of extensive coronary collateral circulation complicate their use as models for chronic or acute myocardial infarction.40 In turn, porcine models are favoured for ischaemic and post-infarction studies due to similarities in heart size and coronary anatomy to humans and limited collateral circulation; yet, electrophysiological differences exist.41 Pigs exhibit more extensive transmural penetration of the Purkinje system than humans, and some repolarizing currents differ from those in humans, with altered action potential morphology, duration and restitution properties, all of which may influence propagation patterns and the stability of re-entrant activity during VF.33–35
Additionally, most VF animal studies are conducted in young, otherwise healthy animals (see Table 1).42–50 This fails to capture and reflect the complex and heterogeneous myocardial substrates present in patients who are at risk of VF, including post-infarct replacement scar, diffuse interstitial fibrosis, myocardial hypertrophy, the effects of metabolic diseases, such as diabetes mellitus, or the modulation by pharmacotherapy. Age- and sex-related changes are also known to influence cardiac electrophysiology and arrhythmia susceptibility but are rarely addressed.51,52 Furthermore, the requirement for general anaesthesia in invasive studies alters autonomic tone and electrophysiological behaviour, likewise challenging the translational value of experimental VF studies for clinical events of sudden cardiac arrest.53
Table 1: Overview of key terminology in ventricular fibrillation research42–50
| Term | Definition | Surface mapping appearance | Common pitfalls and misinterpretations |
| Wavelet | Short-lived activation wavefront not anchored to a fixed circuit | Short linear or curved activation lines that may exist as part of a continuously changing population of wavelets (‘multiple wavelets’) | Apparent fragmentation may reflect limited spatial resolution and/or failure to account for intramural 3D propagation rather than true wave break |
| Wave break | Local failure of propagation due to heterogeneous refractoriness (functional), anatomical barriers and wavefront curvature or source–sink mismatch44,45 | Sudden termination or splitting of an activation front | Often inferred from surface maps without accounting for intramural continuity or spatial resolution |
| Vortex shedding | Detachment of propagating wavefronts at the edge of an obstacle caused by wave break when local curvature exceeds a critical threshold (vortex = rotating electrical wavefront)46 | Wave break with rotating/propagating wavefronts emerging at the edge of an obstacle, the same obstacle may generate new wavefronts with successive activations | A mechanism of ‘wave generation’, rather than a mechanism underlying VF maintenance |
| Phase Singularity | Point in a phase map where phase is indeterminate, represents sites of wave break and pivot points on which a wavefront may hinge42 | Point in a phase map where phase is indeterminate, surrounded by points showing a complete phase change of 2π | PS may represent pivot points of rotors, yet, not all PS correspond to stable re-entry; may reflect transient fragmentation or colliding wavelets43 |
| Rotor | Organized functional re-entry around an excitable but unexcited core (in 2D)47; in broader definitions the term may also include anatomically anchored, as opposed to purely functional, rotational activity | Stable or meandering rotational activity with high local frequency (stability over time is required to distinguish from transient wave break) | Presence of rotors does not automatically imply hierarchical dominance; Surface rotor may be a projection of an intramural scroll wave; Short-lived or drifting rotors may be dismissed as noise despite mechanistic relevance; Inconsistent use of the term to describe purely functional vs also anatomically anchored rotational activity |
| Mother rotor | Dominant (primary) high-frequency re-entrant driver generating peripheral fibrillatory conduction | Stable high-frequency rotational source with surrounding regions exhibiting wave break/block | Co-existence of multiple drivers (rotational or non-rotational) possible |
| Spiral wave | 2D representation of the curved vortices generated by a spinning rotor48 | Curved, rotating wavefronts | *Same as rotor |
| Scroll wave | 3D extension of a spiral wave48 | Paired or discordant epicardial/endocardial rotation; focal breakthroughs | Cannot be conclusively identified from surface mapping, mainly studied in computational models |
| Filament | Core of a scroll wave (3D), representing the longitudinal structure around which functional re-entry occurs48 | Dependent on filament geometry/shape (‘I’ spanning endocardium to epicardium, ‘U’ connecting to the same surface, ‘O’ may remain intramural) | Filament geometry has so far been inferred and/or modelled mainly in computational simulations; electro-mechanical filaments have been described in experimental studies49 |
| Driver | Localized source that plays a causal role in sustaining fibrillatory activity; its suppression or removal alters or terminates fibrillation | Site or region of functional dominance with relative temporal stability and/or higher activation rate organizing/dictating the surrounding activation patterns | Mechanistically non-specific (may be re-entrant or focal or self-perpetuating wavelets)50 Dominance inferred from surface mapping may not imply true causality |
| Focal source | Discrete site of impulse initiation (automatic or triggered) | Centrifugal activation pattern | May represent breakthrough from intramural scroll waves (‘pseudo-focal activation’) |
PS = phase singularity; VF = ventricular fibrillation.
Technical challenges of mapping ventricular fibrillation
The ethical and translational constraints outlined above are compounded by fundamental technical challenges inherent to mapping VF itself. VF is a highly dynamic arrhythmia characterized by rapid, irregular activation, wavefront fragmentation and complex transmural interactions. Accurate mechanistic characterization would require simultaneous, global, high-resolution mapping across the entire ventricular myocardium, including the intramural space. No currently available technology fulfils these requirements.
Most in vivo studies rely on surface-based recordings from either the epicardium or the endocardium, often with only incomplete (segmental) spatial coverage (see Table 2).13–15,20,21,54–73 Epicardial sock arrays have been proposed to allow global, simultaneous recording; yet, they require open-chest access, are restricted to unipolar electrograms and have relatively wide inter-electrode distances for the characterization of VF wavefronts and fragmentation (for a 256-electrode sock around 8 mm).74,75 Endocardial mapping tools, such as basket catheters, face similar limitations, with inconsistent electrode–tissue contact and low spatial density.76,77
Table 2: Overview of existing studies on long-duration ventricular fibrillation in large animal and human models (chronological order)13–15,20,21,54–73
| Publication | Year | Animal model and sample size | Mapping device | Mapping site and VF duration | Main analysis | Main finding |
| Worley et al.61 Am J Cardiol | 1985 | Dog In vivo N=26 in vivo | Five plunge needles (25 electrodes) | Transmural 20 min |
|
|
| Pierpont et al.62 Am J Physiol Heart Circ Physiol | 2000 | Dog In vivo N=7 HF N=6 control | Non-contact 64-electrode LV balloon (1.8×4.6) | Endo LV 5 min |
|
|
| Huang et al.13 Am J Physiol Heart Circ Physiol | 2004 | Dog In vivo N=6 | 504-electrode epi plaque (21×24 array), 2 mm spacing, covered 20 cm2 (20% of epi) | Epi 10 min |
| VF was divided into five stages based on cluster analysis:
|
| Moreno et al.60 Cardiovasc Res | 2005 | Sheep Ex vivo N=8 HF + control | Optical mapping on anterior RV and LV (4×4 cm2) | Epi 5 min |
|
|
| Allison et al.54 J Cardiovasc Electrophysiol | 2007 | Dogs N=7 Pigs N=6 In vivo | 50–60 plunge needles (six electrodes), 2 mm spacing, through LV free wall | Plunge needles 10 min |
|
|
| Tabereaux et al.63 Circulation | 2007 | Dogs Ex vivo N=6 | 504-electrode array (24×21, 1 mm spacing) | Endo ant pap muscle 10 min |
→ 36 segments analysed
| Purkinje activations involved in the majority of WF during VF 1,018 PFs or focal WFs identified
|
| Huizar et al.57 Am J Physiol Heart Circ Physiol | 2007 | Pigs Ex vivo N=6 | Optical mapping (ant LV, 35×35 mm, 64×64 pixels) volume-conducted ECG | Epi ant LV 10 min |
| Three distinct phases of local VF dynamics identified:
|
| Li et al.64 Circ Res | 2008 | Pigs In vivo N=12 N=6 for plunge needle | 504-epi array (2 mm spacing, 1.8×1.8×1.2 cm) Needle array (9×9, 6-electrode with 2 mm spacing) | Epi and transmural 10 min | AT based on -dV/dt, WF based on AT of adjacent samples
| 80,565 components detected, with different incidence: 0.5% re-entrant, 12.8% multiple WF, 86.6% single WF
|
| Dosdall et al.55 Am J Physiol Heart Circ Physiol | 2008 | Dog Ex vivo N=6 Lugol N=6 control | 504-electrode-array endocardium + 6 plunge needles on each side of plaque | Endo (ant pap) + transmural 10 min | Endocardial ablation with Lugol solution versus control
|
|
| Kong et al.65 Heart Rhythm | 2009 | Dog Ex vivo N=6 | Transmural optical (bundle of optrode at eight transmural points separated by 1.5 mm) | Transmural 10 min |
|
|
| Robertson et al.66 Heart Rhythm | 2009 | Pig In vivo N=10 | 504-electrode epi plaque + floating microelectrode | Epicardial + intramural 20 min |
|
|
| Li et al.56 Am J Physiol Heart Circ Physiol | 2010 | Dogs In vivo N=6 | 3D transmural electrode matrix (9×9×6, 2 mm spacing) – area 16×16×10 mm3 | Transmural LV free wall 10 min |
|
|
| Robichaux et al.15 J Cardiovasc Electrophysiol | 2010 | Dog In vivo N=6 | 64-electrodes basket catheter in LV, pacing from RV +12 lead ECG | Endo RV and LV 10 min |
|
→Synchronized activation = focally from Purkinje, LVCL>RVCL |
| Taylor et al.67 Am J Physiol Heart Circ Physiol | 2012 | Dog Ex vivo N=28 N=9 control, N=6 in GLYB (IKATP blocker) | Epicardial optical mapping 40×40 to 65×65 mm 10 plunge needles in lateral free wall | Epi and transmural 10 min |
|
|
| Kong et al.68 Am J Physiol Heart Circ Physiol | 2012 | Dog Ex vivo N=6 | Five intramural eight-fibre optrodes in ant LV wall towards ant. muscle | Epi, mid- and endo 5 min |
|
|
| Venable et al.69 Am J Physiol Heart Circ Physiol | 2010 | Dogs In vivo and ex vivo N=19 | Plunge needles at junction RV, LV, septum In vivo Epi optical mapping ex vivo | Transmural in vivo Epi ex vivo 8 min |
|
→Complex VFR gradients during LDVF cannot be explained solely by distribution of Purkinje fibres |
| Cheng et al.70 Am J Physiol Heart Circ Physiol | 2012 | Pigs In vivo N=6 | 504-electrode arrays (ant and posterior LV) ± 40% of epicardium | Epi 10 min |
| In pigs, only four stages of VF exist
|
| Jin Q et al.71 Heart Lung Circ | 2013 | Dog In vivo N=12 | 2×64-electrode basket catheters in LV and RV | Endo RV and LV 7 min |
|
|
| Li et al.14 Circ Arrhythm Electrophysiol | 2013 | Dogs In vivo N=6 control N=6 pinacidil N=6 flunarizine | 2×64-electrode basket catheters in LV and RV | Endo RV and LV 7 min | Quantification of organization level:
|
|
| Lin et al. 72 Croat Med J | 2014 | Dogs In vivo N=11 (Lugol=5, control=6) | 64-electrode basket catheter in LV | Endo LV 7 min |
|
|
| Huang et al.20 J Am Heart Assoc | 2014 | Pig and dog In vivo and ex vivo N=6, dog N=6 pig +10 dog ex vivo | 504-electrode epi plaque (24×21-electrode) anterior LV + two rows of plunge (12-electrode) | Epi Transmural 10 min | In vivo AR recordings epi and transmurally Ex vivo perfused dog heart microelectrodes into Purkinje and myocardial cells |
|
| Jackson et al.58 JACC Clin Electrophysiol | 2015 | Human Ex vivo N=12 | Plunge needle (25×4-electrode) and endo balloon array (112-electrode) and epi sock array (112-electrode bipoles) | Endo Epi Transmural 10 min |
|
|
| Panitchob et al.59 Circ Arrhythm Electrophysiol | 2017 | Dogs In vivo N=6 | 64-electrode Basket in LV 54×6-electrode plunge needles | Endo Transmural 7 min | Endocardial activation patterns:
|
→Regular and synchronized patterns of activation were driven by rapid activations on the endo surface that blocked and broke up transmurally → endo-to-epi AR gradient as LDVF progresses →Failed shocks changed chaotic and regular activation to synchronized patterns in LDVF but not in SDVF |
| Luo et al.73 BMC Cardiovasc Disord | 2017 | Dogs In vivo N=6 control N=6 HF | 2×64-electrode basket catheter in RV and LV | Endo 7 min |
|
|
| Hasegawa et al.21 HeartRhythm Case Rep | 2020 | Human In vivo on ECMO N=1 | Endo contact mapping Perfused arrest | Endo 5 days (on ECMO) | Contact mapping → EGM, manual identification of Purkinje |
|
ant = anterior; AP = action potential; APA = AP amplitude; APD = action potential duration; AR = activation rate; AT = activation time; Ca2+ = calcium; Cai2+ = intracellular calcium; CaT = calcium transient; CCB = calcium channel blocker; CL = cycle length; CV = Conduction Velocity; DF = dominant frequency; DFT = defibrillation fibrillation threshold; DI = diastolic interval; dV/dt = change of voltage over time; ECG = electrocardiogram; ECMO = extracorporeal membrane oxygenation; EGM = electrogram; endo = endocardial; epi = epicardial; FFT = fast Fourier transform; GYLB = glybenclamide; HF = heart failure; LAT = local activation time; LDVF = long-duration ventricular fibrillation; LSVF = locally synchronised VF; LV = left ventricle; Median_F = excitation frequency; Nr = number; pap = papillary; PF = peak frequency; PS = phase singularity; reg-idx = regularity index; RPD = recurrence of propagation direction; RV = right ventricle; SD = standard deviation; SDVF = short-duration ventricular fibrillation; sep = septal; SR = sinus rhythm; syn-idx = synchronicity index; VF = ventricular fibrillation; VFR = ventricular fibrillation activation rate; Vm = membrane voltage; WB = wave break; WBI = wave break incidence; WF = wavefront.
Non-contact mapping approaches, including inverse solution-based systems, have been proposed to study fibrillatory activity and enable panoramic acquisitions without direct myocardial contact.78,79 However, their accuracy deteriorates with increasing distance from the myocardial surface, and the signal averaging required in some non-contact systems to stabilize reconstructions may obscure transient or high-frequency phenomena critical to VF dynamics.80,81 As a result, these systems are no longer routinely in use. Similar limitations apply to electrocardiographic imaging (ECGI), which has been proposed for VF mapping but is strongly dependent on implementation choices (such as the cardiac source model and regularization method).17,82,83 Reported performance has been suboptimal even for more organized rhythms during functional substrate mapping, raising concerns about its ability to resolve the rapid, spatially complex and temporally dynamic activation patterns that are characteristic of VF.84
Alternative non-invasive approaches based on high-frame-rate ultrasound circumvent the inverse problem of electrocardiographic imaging (ECGI) by inferring activation from direct tissue-based recordings of electromechanical activation patterns. These electromechanical mapping techniques have been proposed to resolve transmural activation patterns and have provided novel insight into true 3D mechanical scroll-wave dynamics during VF.85,86 Nevertheless, the complex and frequently altered relationship between electrical and mechanical activation, particularly in diseased myocardium, may constrain their ability to accurately characterize the underlying drivers of VF in the presence of myocardial scar and fibrosis, where their performance has been shown to be less reliable even for the mapping of organized ventricular arrhythmias.87
Lastly, optical mapping is a modality that offers unparalleled spatial and temporal resolution and has been instrumental in elucidating fundamental principles such as functional re-entry during VF.88,89 However, optical techniques are typically limited to ex vivo preparations and frequently employ an electromechanical uncoupler, both of which have important effects on cardiac electrophysiology and are restricted to the segmental evaluation of the surface or near-surface of the myocardium.90,91
A particularly important and unresolved limitation across all these (surface-based) approaches is the inability to directly visualize 3D activation and repolarization patterns. Distinct intramural phenomena, such as scroll waves with filaments that may intersect the surface, may manifest as focal breakthroughs or transient rotational activity on epicardial or endocardial maps. Without direct transmural information, such surface patterns are inherently ambiguous.64 While plunge needle electrodes have been used to sample intramural activity at locally high resolution, their overall spatial coverage is limited, and the potential for mechanical and/or electrophysiological distortion by the needles themselves further complicates interpretation.54–56
Implications for mechanistic interpretation
Collectively, these ethical, translational and technical constraints have profound implications for the interpretation of VF mapping studies. Many of the apparent discrepancies in the VF literature may not indeed represent true biological disagreement, but arise from differences in experimental context, mapping technology and the spatiotemporal scale and duration at which fibrillatory activity was interrogated. Importantly, mechanisms inferred from surface recordings may only represent a projection of more complex 3D dynamics occurring within the myocardial wall.
Recognizing these limitations is essential when integrating evidence across studies, such as those reviewed below, and restricts extrapolating findings from any single model or mapping modality. These challenges also underscore the importance of developing new experimental and analytical approaches capable of capturing VF as a dynamic, 3D process that evolves over time.
Analysis of cardiac fibrillatory activity
Interpretation of results of VF mechanisms requires a good understanding of the analytical tools and signal processing approaches employed to identify and describe electrophysiological concepts such as re-entry, wavelets and focal activity, including their limitations. Here, we outline three commonly used VF mapping approaches, frequency analysis, phase mapping and entropy-based analysis. Key mechanistic concepts and terminology used in VF research are summarized in Table 1.42–50
Dominant frequency mapping
Traditionally, intracardiac electrograms are analysed in the time domain, plotting the amplitude of the signal against time and identifying local activation times (LATs) via peaks or maximal derivatives of the signal.92 In VF, electrogram amplitude and morphology fluctuate, rendering conventional LAT assignment unreliable. To address this challenge, dominant frequency (DF) analysis has been proposed.93 DF analysis is applied to a given time window, dissecting the electrogram into its frequency components and creating a power spectrum based on their amplitudes. Identifying the ‘dominant’ frequency as the frequency with the highest spectral power at each recording location allows determination of the activation rate of the ventricular signals from that particular location.94 This was an important development for evaluating fibrillatory dynamics as it facilitated the assessment of spatial organization and distribution of excitation frequencies during VF.95,96 Figure 1 shows examples of epicardial DF maps during sustained VF. Limitations of this approach include poor temporal resolution due to the requirement of estimating DF over a time window, as well as a trade-off between the length of the time window and the resolution of the frequency spectrum. Information on the instantaneous temporal evolution of the spectral characteristics can therefore be lost and, furthermore, high-frequency drivers may be migratory, and traditional techniques may fail to account for this.97 Some advanced frequency analysis approaches, such as the wavelet transform-based analyses, may overcome some of these limitations by enabling improved characterization of non-stationary and transient spectral features; however, they can be computationally more intensive.98
Figure 1: Dominant frequency maps
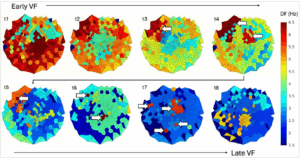
DF mapping allows to evaluate the spatial distribution of excitation frequency during VF across the mapped surface without relying on conventional LAT assignment, and to localize high-frequency sites that may drive VF. The figure shows examples of epicardial DF maps derived from an epicardial sock array in an in vivo porcine model and visualized as 2D polar plots (centre = apex; upper hemisphere = anterior surface; lower hemisphere = inferior surface). Top: Early VF is characterized by widespread rapid activation rates (red). As VF progresses, spatial heterogeneity in DF increases and localized sites of higher frequency (t3–t4) emerge, suggesting a more hierarchical organization. Bottom: Later stages of VF are marked by an overall decline in activation rate (green/blue), yet local sites of high-frequency drivers persist (t5–t7). The myocardium becomes increasingly unexcitable, and in the very later stages of VF, the residual ‘high’-frequency drivers are progressively slowing (t8). Figure 1 plots were created in MATLAB (MathWorks®, Natick, MA USA) and arranged in and exported from Microsoft PowerPoint (Microsoft, Redmond, WA, USA)
DF = dominant frequency; LAT = local activation time; VF = ventricular fibrillation.
Phase mapping
Phase represents a fundamental characteristic of a signal and may be used to describe repetitive or oscillatory processes, where the state of the system is represented as a phase angle (θ).42 In the context of VF mapping, each point on the myocardial surface can be assigned a phase angle, and the progression of θ is then tracked over time.43 One of the main advantages of phase mapping is that it does not rely on the annotation of activation times from complex and changing low-amplitude electrograms to construct activation maps, but, instead, analyses the distribution of phase to assess underlying activation patterns.42
To track wavelets and detect and characterize rotational activity, the phase of all electrograms that are acquired over the epicardium and/or endocardium is analysed at every instant of time with high temporal resolution. Phase singularities are points surrounded by a complete cycle of phase and so are connected to a broken wavefront and can be the pivot of rotational activity. Detected phase singularities can then be tracked in the spatiotemporal phase maps to define their lifetime and mobility (Figure 2).43 The development of phase mapping was crucial for describing rotational activity as one of the underlying mechanisms of VF.88
Figure 2: Phase maps and corresponding unipolar voltage maps
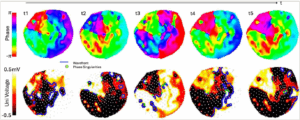
The development of phase-mapping techniques to study fibrillatory dynamics has been fundamental for VF research, notably for the detection and characterization of rotational drivers. Top: Examples of sequential screenshots (t1–t5) of epicardial phase maps that allow to track rotational activation wavefronts pivoting around phase singularities progressing through a complete phase change (2π). Rotors may be stationary or migratory. Bottom: Corresponding unipolar voltage maps for each phase map, with superimposed phase singularities (marked as green dotes) and wavefronts (plotted as blue lines). White dots represent electrode locations. Individual plots were made in MATLAB (MathWorks®, Natick, MA USA) and Microsoft PowerPoint (Microsoft, Redmond, WA, USA) for arranging the plots together and exporting
Uni = unipolar; VF = ventricular fibrillation.
Entropy-based analysis
In addition to frequency- and phase-based approaches, measures from information theory have been applied to quantify the regularity and complexity of fibrillatory activity.99 Entropy is defined as a measure of ‘disorder or uncertainty in a system’, and entropy-based metrics of electrophysiological signals have been used to quantify the (ir)regularity or complexity of VF waveforms.100 Unlike phase mapping, entropy-based measures do not explicitly identify activation patterns per se, but rather provide a local or global assessment of the underlying ‘state’ of VF, thereby distinguishing more organized from more disorganized fibrillatory activity. A main research interest has been to apply entropy metrics to surface-electrocardiography (ECG) VF waveforms to predict defibrillation outcomes in cardiac arrest, rather than to directly identify mechanistic VF drivers.99
Multiple forms of entropy analysis have been proposed, each capturing slightly different aspects of signal regularity and structure. For example, ‘Shannon entropy’ is based on amplitude distribution and quantifies its ‘unpredictability’, reflecting signal heterogeneity (Figure 3).17 In turn, for example, ‘fuzzy entropy’ assesses the similarity of temporal patterns over time, capturing the temporal predictability of the signal.101
Figure 3: Entropy estimation
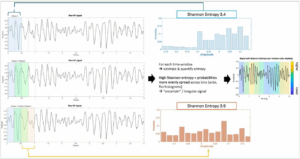
The top-left panel shows a segment of the raw VF electrogram. Subsequent subpanels on the left illustrate the application of sliding temporal windows over the signal. Each window represents a short segment of the VF waveform over which signal complexity is quantified; sliding windows are overlapping to provide a continuous estimate of signal organization over time. In the middle panel, two examples of amplitude histograms from the raw VF signal are shown using 16 bins. Shannon entropy measures the uncertainty or irregularity of a signal by quantifying the distribution of amplitude values within each window: the maximum possible entropy occurs if all bins are equally likely (maximum uncertainty). The numeric output of entropy is relative to the number of bins used – in this example, both windows show relatively high signal complexity. On the right, the raw VF signal is plotted with Shannon entropy shown as shaded colours overlying the respective time window, illustrating how signal organization varies over time (only consecutive windows are coloured to facilitate interpretation of colours without overlap). Graphs were made in MATLAB (MathWorks®, Natick, MA, USA) and compiled together and exported from Microsoft Powerpoint (Microsoft, Redmond, WA, USA)
VF = ventricular fibrillation.
A common feature of entropy metrics is that they are calculated on electrogram time series within defined temporal windows. In general, higher entropy values indicate increased signal complexity and reduced temporal organization, while lower values reflect more repetitive or organized activity. In turn, limitations of entropy-based analysis include sensitivity to parameter choice, with a notable absence of guidelines on their selection, dependence on signal length and noise characteristics and limited spatial specificity.99
Frequency-, phase- and entropy-based mapping approaches should be considered complementary rather than stand-alone tools for VF analysis, with each extracting distinct properties from fibrillatory waveforms.
Mechanisms sustaining ventricular fibrillation: concepts and evidence
Ventricular fibrillation as a dynamic evolving process
A consistent observation across experimental studies was that sustained VF is not a mechanistically uniform arrhythmia but evolves dynamically over time, as metabolic conditions deteriorate during global myocardial ischaemia, which alters electrophysiological properties. This temporal evolution was recognized nearly a century ago.102 In seminal canine experiments employing high-speed cinematography and electrocardiography, Carl Wiggers described four sequential stages of VF (I=‘undulatory’, II=‘convulsive’, III=‘tremulous’, IV=‘atonic’), characterized by progressive slowing of activation rate and declining mechanical activity as ischaemia progresses. Subsequent experimental work built on this concept, proposing three-, four- or five-stage VF models depending on species, mapping methodology and analytical metrics.13,57,103 For example, Huang et al. described, also in dogs, a rapid increase in VF metrics (such as number of wavefronts, fractionations and incidence of re-entry and focal activation) within the first seconds of VF (1–11 s), followed by rapid dynamic fluctuations during stage II (12–62 s) and greater organization in stage III (63–86 s), which thereafter decreased steadily in stage IV (87–310 s) prior to approaching zero during stage V (311–600 s).13
In contemporary literature, VF is often more pragmatically divided into SDVF, typically lasting <1–3 minutes, and LDVF, extending beyond this period.12,58 While somewhat arbitrary, this distinction reflects a fundamental feature of VF: the arrhythmia actively and rapidly alters its own substrate secondary to the immediate loss of cardiac output at VF onset. SDVF occurs under relatively preserved metabolic conditions, whereas LDVF unfolds in the context of progressive global ischaemia with increasingly impaired excitability and heterogeneity in refractoriness.18 These changes significantly influence VF dynamics and mechanisms maintaining it.
Recognizing VF as a time-dependent process is critical, as mechanistic conclusions drawn from SDVF cannot be directly extrapolated to later stages encountered during clinical cardiac arrest.
Competing frameworks: anarchy versus hierarchy
Wave break, caused by a localized conduction block at a specific site along the wavefront while other portions continue to propagate, is an established hallmark of cardiac fibrillation.104 Possible mechanisms that may result in wave break are anatomical barriers, heterogeneity in refractoriness in the tissue, critical wavefront curvature and source–sink mismatch.48 Yet, the exact mechanisms that sustain and perpetuate the on-going wave breaks during VF, especially in its later stages, remain an area of on-going debate. Figure 4 illustrates a schematic of different proposed mechanisms underlying sustained VF.
Figure 4: Overview of proposed mechanisms sustaining ventricular fibrillation
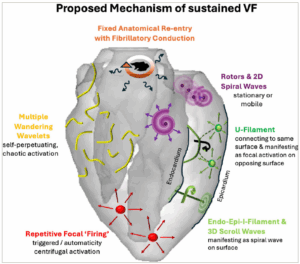
Multiple mechanisms may co-exist and/or interact within a single episode of VF. The dominant mechanism can vary with VF duration, metabolic state and pre-existing structural alterations, and may shift dynamically over time. Figure 4 was created in Microsoft PowerPoint (Microsoft, Redmond, WA, USA)
VF = ventricular fibrillation.
Historically, the debate regarding VF maintenance has centred on two seemingly opposing conceptual frameworks. The ‘anarchical’ multiple wavelet hypothesis proposes that cardiac fibrillation is sustained by numerous, continuously fragmenting self-perpetuating wavelets that propagate through the myocardium along constantly changing pathways, with fibrillation persisting as long as sufficient myocardial mass allows the continued generation of daughter wavelets.105 Experimental mapping studies in animal models that have recorded highly complex activation patterns with frequent wavefront fragmentation in the absence of a primary rotational driver supported this view.106,107
In contrast, the ‘hierarchical’ or mother rotor hypothesis posits that VF is organized around one or more discrete high-frequency sources, typically functional re-entrant circuits, that act as drivers.108 From these drivers, wavefronts propagate into surrounding myocardium with longer refractory periods, resulting in intermittent conduction block and spatially complex activation patterns, often described as ‘fibrillatory conduction’. Optical and electrical mapping studies demonstrating relatively stable, high-frequency rotational activity with surrounding disorganization have provided supporting evidence for this framework.88,96
Based on these apparently contradictory experimental findings, some studies suggested that indeed there may be two different types of VF: type 1 (fast) VF, associated with steep action-potential-duration restitution, flat conduction velocity restitution and multiple wavelets, versus type 2 (slow) VF, associated with flat action-potential-duration restitution, decreased excitability and spatiotemporal periodicity in activation maps.109,110 However, on the other hand, they may also represent different and/or interacting manifestations of the same underlying dynamics observed at different spatial scales, anatomical locations and time points, and/or indeed may co-exist.10 Rapid re-entrant sources can generate wavefronts that fragment as they encounter heterogeneities, giving rise to multiple wavelets that may self-perpetuate. Conversely, wavelet interactions can themselves create new sites of re-entry that may stabilize and result in new frequency-dependent fragmentation into multiple wavelets.50 Thus, VF may not be sustained by either mechanism alone, but rather by their continuous interaction.
The more contemporary VF debate has increasingly incorporated computational modelling and in silico studies alongside experimental investigation. While the present article focuses primarily on experimental evidence, computational studies have both helped to interpret experimental findings as well as provided important complementary insights by exploring possible electrophysiological dynamics that are difficult to capture experimentally.111
Insights from computational modelling
With respect to the historical ‘anarchy versus hierarchy’ debate, computational studies have demonstrated that both multiple wavelet behaviour and organized high-frequency re-entrant drivers may emerge from the same underlying substrate depending on restitution slope, conduction properties and tissue heterogeneity.112–115 These findings support the concept discussed above that hierarchical and self-perpetuating wavelet frameworks are not mutually exclusive mechanisms, but rather represent different manifestations of non-linear wave dynamics observed under variable conditions and substrates.
A particularly important contribution of modelling lies in resolving the inherent ambiguity of surface-based mapping. 3D simulations have shown that intramural scroll waves with filaments extending through the ventricular wall may drive VF, and may manifest on the epicardial or endocardial surface as focal breakthroughs, spiral waves or apparently disorganized activation patterns.116,117 Surface activation maps do not necessarily provide a complete representation of the underlying mechanism, as they may reflect a projection of organized intramural dynamics, which currently escape experimental techniques but can be explored in computational models.
Computational approaches have also provided insight into the time-dependent electrophysiological changes secondary to acute myocardial ischaemia, including reduced excitability, conduction slowing, altered refractoriness and gap junction uncoupling, all of which may modulate VF dynamics.18,118 Such frameworks may help inform more realistic VF simulations accounting for the time–dependent evolution of the arrhythmogenic substrate under deteriorating metabolic conditions. Lastly, incorporation of an anatomically detailed His–Purkinje system has enabled the evaluation of the potential contribution of the specialized conduction system to the initiation and maintenance of VF.119 The combination of realistic anatomical models, dynamic metabolic perturbations and ischaemia responses may help explain transitions between re-entry-dominated and focal or Purkinje-mediated activity observed experimentally during LDVF.
At the same time, it is important to emphasize that models ‘only’ approximate reality and rely on assumptions and simplifications regarding tissue structure and the mechanisms underlying the action potential. Most existing modelling frameworks do not capture the biophysical details of individual myocytes, and neither do they include the dynamic metabolic and autonomic alterations that characterize prolonged VF. Modelling studies have to balance the level of detail against the computational cost of simulations, with model complexity chosen according to the type of study that is being undertaken. Consequently, in silico findings should be interpreted within the context of their underlying parameterization and complexity. Nevertheless, the detailed integration of experimental observations with computational modelling offers a powerful tool to interrogate mechanisms that, for now, remain inaccessible to direct measurements in vivo.
Evidence from human short-duration ventricular fibrillation
Intra-operative epicardial mapping studies during brief episodes of VF have demonstrated that early human VF often exhibits a higher degree of organization than that observed in animal models of comparable heart size.10,11 These studies reported activation patterns consistent with both re-entrant activity and wavelet propagation, suggesting co-existence rather than exclusivity of mechanisms.
High-resolution optical mapping studies in explanted Langendorff human hearts have further supported this view.120 Analyses of brief VF segments revealed relatively slow conduction velocities (CV), around 0.25 ± 0.04 m/s during VF compared with CVmax (maximum conduction velocity) of 0.87 m/s during pacing, and the presence of large, coherent wavefronts spanning wide regions of myocardium. Compared with canine or porcine hearts, human VF displayed longer activation cycle lengths and fewer simultaneous wavefronts. This has been attributed to longer minimum action potential durations in humans, which increase wavelength and may limit activation rate and the number of sustainable re-entrant circuits or wavelets at any given time.36
SDVF studies combining epicardial and endocardial mapping in patients with cardiomyopathy have provided additional insights.121 Short episodes of VF were often characterized by wavefronts emanating from a limited number of sites, frequently localized to endocardial regions of low voltage, a surrogate for scarred tissue. This was supported by histopathological correlation in explanted human hearts with dilated cardiomyopathy, demonstrating greater fibrosis at sites of conduction block and re-entry during brief episodes of VF, suggesting a role for structural heterogeneity in anchoring or stabilizing re-entrant activity.122 Lastly, simultaneous endocardial–epicardial recordings have also revealed rotational activity of similar cycle length and chirality on both surfaces, consistent with transmural re-entry in the form of scroll waves, with histopathology also showing greater fibrosis at sites of re-entry than in regions without.123
Notably, across these human SDVF studies, repetitive focal firing from the Purkinje system was not observed.
Long-duration ventricular fibrillation: insights from animal models and ex vivo human hearts
Mechanistic investigation of in vivo LDVF has only been possible in large-animal models, but not in humans. These studies revealed substantial differences in VF drivers when compared with early VF, particularly with respect to activation rate gradients, endocardial–epicardial dissociation and the emergence of focal activity. A compilation of published studies investigating LDVF and their main findings in large animals or ex vivo human hearts is presented in Table 2 in chronological order.13–15,20,21,54–73
A recurring observation during LDVF is the development of a pronounced endocardial-to-epicardial activation rate gradient, with faster rates recorded near the endocardium. This phenomenon has been most consistently observed in canine and ex vivo human hearts and has been strongly linked to the Purkinje system.15,58,59 In turn, chemical ablation of the Purkinje system abolishes the development of an endocardial–epicardial gradient.55 Purkinje fibres exhibit relative resistance to ischaemia, attributed to higher glycogen content and partial perfusion from the ventricular cavity, which may enable them to remain excitable when the working myocardium has already become severely compromised.124,125
Most of these studies have recorded repetitive, rapid Purkinje activation preceding myocardial activation during LDVF, consistent with a focal driver role. Proposed mechanisms include abnormal automaticity or triggered activity mediated by calcium-dependent afterdepolarizations under metabolic stress.126 Importantly, Purkinje-driven activity does not exclude concurrent re-entry. Rather, focal excitation may interact with residual re-entrant circuits or generate wavefronts that fragment upon encountering heterogeneous tissue, contributing to on-going fibrillatory conduction. Whether, or not, in the very late stages, when re-entrant and self-perpetuating wavelet mechanisms may no longer be viable due to widespread conduction failure, they may represent the sole driver of on-going electrical activity remains unclear.
Ventricular fibrillation dynamics in structural heart disease
Despite numerous experiments (Table 2), LDVF studies integrating electrophysiological observations with underlying myocardial structure are limited. Although myocardial scar and associated electrophysiological alterations are well-established determinants of organized macro-re-entrant ventricular tachycardia, their specific contribution in sustaining and modulating VF, particularly during later stages of VF, remains poorly defined.127–129
Most experimental LDVF studies have been conducted in structurally normal hearts, with relatively few using models of pacing-induced heart failure.60 The small number of investigations that have incorporated structural assessment alongside electrophysiological mapping typically recorded only SDVF segments and relied on limited histological sampling in ex vivo conditions or indirect inference using voltage mapping (see above).121–123 In turn, data from small-animal perfused ex vivo models suggest that fibrosis patterns and gap junction coupling influence activation patterns during prolonged fibrillation, but marked interspecies differences between rodents and humans and the methodological approach (stable perfused condition) prevent direct translation to human cardiac arrest.130
Future directions
Collectively, the evidence reviewed supports a view of VF as a dynamic arrhythmia with multiple interacting and/or co-existing processes whose relative contributions evolve over time, resulting in intermittent spatiotemporal organization and disorganization. Apparent discrepancies among existing mechanistic studies may reflect differences in the investigated VF duration, experimental model, spatial resolution and recording site, as well as signal processing techniques. The historical dichotomy between multiple wavelet and hierarchical driver hypotheses is obsolete and fails to capture the complexity of activation patterns observed during VF.
A central unresolved question is the role of underlying myocardial structure as an active determinant of VF dynamics. Structural remodelling, including scar architecture, heterogeneity, altered fibre orientation, hypertrophy, etc., modulates conduction–repolarization properties, source–sink balance and preferential anchoring of re-entrant circuits, thereby may mechanistically shape VF maintenance and influence the response to interventions to terminate it.127 This gap in knowledge is particularly relevant given the diversity of substrates predisposing to and underlying VF in patients, including chronic infarction, inherited and acquired cardiomyopathies, acute ischaemic events or primary electrical diseases. Sustained VF dynamics are unlikely to ever be fully understood without explicit consideration of the underlying substrate.
The time-dependent and likely substrate-specific effects support the need for mechanistic phenotyping of VF. Rather than treating VF as a uniform entity, this framework would aim to identify dominant sustaining processes and their temporal evolution within defined clinical disease models. Such mechanistic phenotypes may differ in their susceptibility or respective response to defibrillation, pharmacological and/or localized ablative interventions, and their propensity for recurrence. For example, VF sustained predominantly by Purkinje-mediated focal activity during prolonged ischaemia may respond differently to anti-arrhythmic drugs and recurrence after defibrillation than VF driven by stable rotors anchored to the border zone of fibrotic myocardium. While such concepts remain largely hypothetical at present, they are supported by experimental observations and established principles of cardiac structure–function–electrophysiology relationships.
Accurate mechanistic phenotyping will require advances in technologies offering true 3D transmural mapping in vivo to distinguish surface manifestations from intramural dynamics (Figure 5). Equally, multimodal investigations integrating electrical, structural and potentially also metabolic and autonomic data are necessary to more comprehensively capture the full complexity of VF dynamics. Third, future experimental models must better reflect the diversity of human disease associated with VF, including clinically relevant patterns of remodelling as well as integration of modulating factors such as age, gender, comorbidities and pharmacotherapy. Experimental work should inform and be complemented by computational frameworks that may be better suited to process such high-dimensional, complex datasets and may provide a valuable tool to explore therapeutic interventions in silico before translation to experimental and clinical studies, including evaluation of anti-arrhythmic drug effects, modulation of gap junction coupling or targeting of Purkinje-mediated activation.
Figure 5: Surface projection versus ‘true’ 3D ventricular fibrillation dynamics
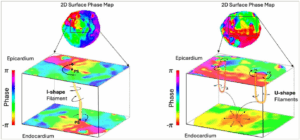
A major shortcoming of contemporary mapping technology is the absence of true 3D mapping. Surface projection of intramural phenomena, such as scroll waves, may be ambiguous and may prevent accurate interpretation of VF dynamics when evaluated by surface mapping alone. Left: Schematic example of an I-shaped filaments spanning across the myocardial wall and manifesting as 2D rotational surfaces on both sides. Right: Schematic examples of two U-shaped filaments which link rotors with clockwise and counterclockwise rotation on the same surface are shown. On the opposing surface, the activation wavefront breaks out with a centrifugal activation pattern mimicking a focal source. Alternative filament geometries have been described, such as L–shaped (connected to one surface, not shown) or O-shaped (may be entirely intramural, not shown). Figure was created in Microsoft Powerpoint (Microsoft, Redmond, WA, USA)
PS = phase singularity; VF = ventricular fibrillation.
Therapeutic implications of ventricular fibrillation phenotyping
In the acute setting of cardiac arrest, an improved substrate-specific understanding of VF mechanisms may help explain time- and potentially driver-dependent variability in defibrillation success and provide a framework for future refinements in defibrillation strategies, including the timing of shock delivery and waveform design tailored to the VF stage and dominant electrophysiological drivers. Recognition of distinct VF dynamics may further inform adjunctive treatment approaches, such as the timing and selection of anti-arrhythmic drug administration and/or the development of mechanism-directed pharmacological interventions aimed at promoting a transition from VF to more organized activation restoring cardiac output.
Beyond the acute phase, mechanistic phenotyping of VF and identification of substrate-specific drivers may contribute to improved management of survivors of cardiac arrest and inform more personalized preventive strategies. VF sustained by rotor-dominated activity anchored to structural alterations, for example, the scar border zone, or by focal Purkinje firing may represent phenotypes amenable to substrate-guided catheter ablation to prevent the maintenance of VF. Furthermore, linking VF mechanisms to underlying myocardial substrate properties could also facilitate the identification of high-risk phenotypes susceptible to sustained VF and support risk stratification, potentially also guiding primary preventive interventions.
While these therapeutic strategies currently remain largely conceptual, integration of advanced electrophysiological mapping, high-resolution imaging and computational modelling may provide a pathway towards mechanism-informed, and ultimately more personalized, approaches to VF management and prevention.
Conclusions
Mechanistic understanding of sustained VF has advanced substantially over recent decades, yet remains incomplete due to fundamental ethical, translational and technical constraints in studying VF. Existing evidence across species and experimental approaches converges on several key principles: VF is not chaotic but displays intermittent degrees of organization; multiple sustaining mechanisms may co-exist within a single episode; and these mechanisms evolve dynamically as metabolic conditions deteriorate. Myocardial structure likely exerts a critical influence on fibrillatory dynamics, yet studies evaluating substrate-specific mechanisms are sparse.
Recognizing VF as a dynamic, time- and substrate-dependent process rather than a single mechanistic arrhythmia reconciles much of the apparent controversy in the literature and provides a conceptual framework for future investigation. Continued progress will depend on the development of true 3D mapping technologies, the integration of structural and functional data, and a shift towards substrate-specific mechanistic phenotyping. Advances in these areas may allow improvements in the prevention and treatment of VF and ultimately enhance outcomes in patients with cardiac arrest.