
Epicardial adipose tissue (EAT) is a fat collection directly adjacent to the myocardium and coronary vasculature, lacking any separation and sharing the same circulation.1,2 This anatomy enables direct signalling between EAT and the surrounding tissue, positioning EAT as a central player in cardiovascular health and disease.1,2 While EAT volume has long been associated with metabolic risk and coronary calcification, emerging data suggest that EAT density – measured via computed tomography (CT) attenuation – provides a more nuanced, complete picture and serves as a predictive marker of local inflammation and adverse remodelling.
Low EAT density, indicative of lipid-full, inflamed tissue, correlates with increased pro-inflammatory cytokines, which can thereby exert their effects on surrounding tissue.3 As will be discussed, clinical studies have demonstrated its prognostic utility. In the major adverse cardiovascular event (MACE) subanalysis of the EISNER trial (Early Identification of Subclinical Atherosclerosis Using Non-Invasive Imaging Research [EISNER]; ClinicalTrials.gov identifier: NCT00927693), EAT density and volume were associated with increased MACE, independent of coronary artery calcium (CAC) and coronary artery disease (CAD).4,5
EAT is also a modifiable target. A recent meta-analysis found that sodium–glucose co-transporter 2 inhibitors (SGLT2-i) significantly reduce EAT volume and thickness, suggesting possible therapeutic agents.6 Whether these changes also affect EAT density remains under investigation. In other studies, it was found that glucagon-like peptide-1 receptor agonists (GLP-1RAs) promote decreased EAT thickness, fatty acid oxidation and brown fat differentiation through activation of EAT-localized GLP-1 receptors.7
This review explores the anatomic and molecular features of EAT, with a particular focus on density as a dynamic biomarker of cardiovascular risk. We highlight the clinical implications drawn from prospective studies, advanced imaging and therapeutic interventions.
Molecular mechanisms and pathophysiology
Anatomy and physiological role
EAT is a unique visceral fat depot, which can be found between the myocardium and the visceral layer of the epicardium, sharing the same microcirculation as the heart due to the absence of any intervening fascial plane, making it unique in its ability to act in a paracrine and vasocrine manner to other tissues, notably cardiomyocytes and the surrounding vasculature.1,2 Unlike pericardial adipose tissue, which lies external to the parietal pericardium and is vascularized by non-coronary arteries, EAT is vascularized by branches of the coronary arteries.1 EAT, which makes up 20% of cardiac weight, is predominantly located along the atrioventricular and interventricular grooves and envelops the coronary arteries directly – a distribution that allows for regional effects on coronary atherosclerosis and myocardial function.2,8 The make-up of this tissue is multicellular and of mesodermal origin, with immune cells and adipose tissue among them, each releasing cytokines that, in turn, travel into the vasculature to which these cells are directly adjacent.9 Adipokines from the adipocytes of EAT can directly modulate the vasa vasorum, endothelial and vascular smooth muscle cells of the coronary arteries.10
Histologically, EAT contains adipocytes, stromal cells, immune cells (notably macrophages and mast cells) and neural elements such as ganglia, reflecting its metabolic and endocrine complexity.10,11 Functionally, EAT acts as a buffer depot for free fatty acids (FFAs), provides mechanical protection and supports myocardial energetics by supplying FFAs through proteins like fatty acid-binding protein 4.1 It also expresses protective adipokines, which contribute to anti-inflammatory and anti-atherogenic signalling.12,13
In early life, EAT has brown-fat-like properties and thermogenic capacity. With ageing and metabolic stress such as obesity, however, EAT undergoes a brown-to-white transition marked by dysfunctional mitochondria, thermogenic gene downregulation and increased lipid storage.14 In states of metabolic stress, excessive lipid accumulation in adipocytes can lead to necrosis or apoptosis, triggering recruitment of inflammatory markers.15 It has also been shown that specific
pro-inflammatory and redox messenger ribonucleic acids (mRNAs) are increased in EAT in CAD, many of which are unique to EAT and distinct from subcutaneous fat tissue.16 These shifts mirror a broader functional change from thermogenesis to energy storage and pro-inflammatory activity.
Pathophysiological transformation
Under pathological conditions such as obesity, diabetes and CAD, EAT becomes inflamed and dysfunctional. Adipocytes in EAT undergo hypertrophy and increased lipid accumulation, accompanied by infiltration of M1 macrophages and the release of pro-inflammatory cytokines such as interleukin-6 (IL-6), monocyte chemoattractant protein-1 (MCP-1) and tumor necrosis factor alpha (TNF-α) (Figure 1).15 This is linked to oxidative stress and ischaemia-induced signalling, resulting in further adipose tissue remodelling and fibrosis.13,15
Figure 1: Schematic representation of the transition of EAT
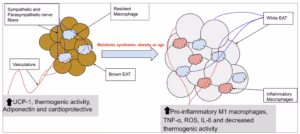
With advancing age, obesity or metabolic syndrome, EAT undergoes transcriptional and functional remodelling. Initially characterized by a brown-fat-like, cardioprotective phenotype with thermogenic capacity, EAT shifts towards a pro-inflammatory white adipose tissue profile. This transition is marked by reduced expression of thermogenic genes, increased lipid accumulation, elevated secretion of inflammatory cytokines (e.g. TNF-α and IL-6), increase in ROS, decrease in anti-inflammatory adipokines such as adiponectin and infiltration of M1-polarized macrophages. As these changes occur, EAT is perfectly situated to influence the surrounding vasculature and myocardium in a vasocrine and paracrine fashion.
EAT = epicardial adipose tissue; IL-6 = interleukin-6; UCP-1 = uncoupling protein 1; ROS = reactive oxygen species; TNF-α = tumour necrosis factor alpha.
Transcriptomic analyses of EAT from patients with CAD demonstrate upregulation of genes related to inflammation, angiogenesis and oxidative stress, further implicating EAT as a potential inducer, not merely a marker, of disease.10 Studies in porcine models have shown that surgical excision of EAT directly overlying coronary arteries attenuates atherosclerotic plaque development in those arterial segments, supporting a causative role via local paracrine inflammation.17 Interestingly, this effect was only observed when EAT directly overlaid the plaque, not at a distance.17
EAT volume versus density
EAT volume reflects the absolute size of the fat depot and has been positively correlated with obesity, metabolic syndrome and coronary calcification. In multiple clinical studies, larger EAT volume has been independently associated with adverse cardiac events.18,19 However, EAT volume alone does not capture the biological activity or inflammatory status of the tissue.
EAT density, measured in Hounsfield unit (HU) via non-contrast CT, provides a more complete picture of tissue biology. Lower EAT density (more negative HU values) indicates lipid-rich, inflamed white fat, whereas higher density suggests more fibrous, metabolically active or brown-like tissue.18,20 Ageing has been shown to decrease brown-fat-like activity in EAT.2,21 CAD is also linked to decreased brown-fat activity and increased white adiposity, characterized by reduced thermogenic gene expression and elevated reactive oxygen species.13 Low EAT density has been linked to dyslipidaemia, low adiponectin and higher levels of MCP-1 and plasminogen activator inhibitor-1 (PAI-1) – key mediators in atherosclerotic inflammation.18,22
Importantly, EAT volume and density are inversely correlated: as volume increases, density tends to decrease.18 While both metrics are independently informative, combining them may enhance cardiovascular risk stratification.
Imaging modalities and quantification
Cross-modality comparison
EAT can be evaluated using several imaging modalities, each with unique strengths and limitations. In echocardiography, EAT can be visualized as a large echo-dense space, especially when it is inflamed or it is a large area.12 While echocardiography is non-invasive, inexpensive and widely available, it is limited by the reader and not as precise as other imaging modalities.23 It is also limited in its utility for evaluating regional variation or inflammatory remodelling. Cardiac magnetic resonance imaging (MRI) provides reproducible volumetric and quality assessment without radiation. In one study of 92 participants, MRI and CT volumes correlated strongly (r=0.92; p<0.001), though CT systematically yielded larger values. MRI fat-signal fraction correlated inversely with CT attenuation (r=-0.72; p<0.001), highlighting complementary information on fat quality.24 Repeatability was high (inter-reader ICC, 0.86; intra-reader ICC, 0.96), but MRI remains limited by availability, cost and lack of standardized acquisition protocols. Collectively, these differences underscore the need for cross-platform harmonization before EAT quantification can be fully integrated into clinical practice.
CT, non-contrast CT and coronary CT angiography, has become the gold standard for EAT quantification due to its high spatial resolution and reproducibility.25 CT allows for the assessment of both EAT volume and EAT density, each offering distinct but complementary insights into cardiovascular risk.25
EAT volume on coronary computed tomography angiography
EAT volume is quantified by segmenting adipose voxels (typically -190 to -30 HU) within the pericardial sac. This method enables comprehensive analysis of total and regional EAT burden, including pericoronary and periatrial compartments.26 Elevated EAT volume has been associated with obesity, metabolic syndrome, CAC and increased risk of MACE.27,28 However, volume alone does not capture inflammatory activity or tissue remodelling. Studies have shown that EAT volume correlates with atherosclerosis and can serve as a surrogate for cardiovascular risk.29
EAT density on computed tomography
EAT density, reported in HU, reflects adipose tissue composition. Lower density (more negative HU values) is indicative of lipid-rich, inflamed white fat, while higher density suggests fibrotic or brown-fat-like characteristics. Goeller et al. used non-contrast CT to quantify EAT density, which was calculated by including contiguous 3D fat voxels between the HU limits of -190 to -30, enclosed by the visceral pericardium.18
Low-density EAT was in the range of approximately -77 ± -4 HU. While EAT volume reflects chronic systemic burden, density captures localized inflammation and remodelling. The use of the fat attenuation index and radiomic analysis further enhances CT’s ability to detect perivascular inflammation and predict lesion vulnerability.30,31
Clinical implications in coronary artery disease, heart failure with preserved ejection fraction and major adverse cardiovascular event
Prognostic role of EAT (volume versus density)
Elevated EAT volume is independently associated with the presence and progression of CAD, CAC and MACE. In the Heinz Nixdorf Recall Study, EAT volume was associated with a significantly higher incidence of incident coronary heart disease, even after adjustment for age, sex, body mass index (BMI) and CAC score, keeping in mind that CAC itself is a strong predictor of coronary events.32 EAT volume has been shown to have a stronger association with coronary events in individuals with no or minimal CAC, suggesting that EAT may influence plaque development through paracrine and vasocrine mechanisms independent of calcification, particularly in the early stages of disease and in relation to non-calcified plaque (Table 1).18,20,22,24,32–36
Table 1: Summary of major studies evaluating EAT volume and density and their association with cardiovascular outcomes
| Study | Patient population | Number of patients | Primary outcome | Main findings |
| Mahabadi et al. (2013) The Heinz Nixdorf Recall Study32 | Participants (age 59.4 years, 47% male), excluded subjects with known CAD, history of myocardial infarction or history of open-heart surgery at baseline | 4,093 | EAT volume and fatal and non-fatal coronary events | EAT volume was significantly higher in subjects with coronary events, with those in the highest quartile having an approximately 5-fold increased risk (p<0.001). This association remained independent after adjustment for cardiovascular risk factors and CAC score |
| Mahabadi et al. (2014) The Heinz Nixdorf Recall Study33 | Participants (45–75 years of age) were randomly selected and excluded subjects with known CAD at baseline or revascularization between baseline and follow-up examination | 3,367 | EAT volume as a predictor for the progression of CAC in the general population | Participants with greater CAC progression had significantly higher EAT volume (101.1 versus 84.4 mL; p<0.0001). Each SD increase in EAT volume independently predicted CAC progression, with the strongest associations observed in younger subjects (<55 years) and lower BMI subjects |
| West et al. (2023)34 | The model was tested in unseen external scans of the SCOT-HEART* trial, and the model was also applied within the AdipoRedOx† study | 253 | EAT volume in relation to CAD, atrial fibrillation, all-cause mortality, MI and stroke | EAT volume was independently associated with CAD (p=0.01) and atrial fibrillation (p=0.03), and also predicted all-cause mortality (p=0.02), myocardial infarction (p=0.001) and stroke (p=0.02) after adjustment for risk factors |
| Pandey et al. (2020)35 | Patients with atypical chest pain with the median age of 51% and 51.8% males | 255 | EAT volume and density in relation to CAD and HRPF | Lower EAT density was significantly associated with obstructive CAD (OR, 0.90; p=0.025) and HRPFs (OR, 0.83; p<0.0001), whereas EAT volume showed no significant association in multivariate analysis |
| Lu et al. (2017) ROMCAT II36 | Subjects with suspected ACS enrolled in the ROMICAT II trial | 467 | EAT volume and density on HRPF | EAT volume was associated with HRPF (p<0.001), and the association persisted after adjustment for risk factors, CAC and stenosis (p=0.040). Subjects with HRPF also had lower mean EAT attenuation (-88.1 versus -86.9 HU; p=0.008) |
| Liu et al. (2023)22 | Patients with HFpEF and excluded patients with history of pericardial diseases, severe liver or renal insufficiency, carcinoma, auto-immune disease, hypercortisolism or who had undergone transthoracic surgery | 154 | EAT density and cardiometabolic risk factors and prognostic value of patients with HFpEF | Even after adjusting for BMI and EAT volume, EAT density remained associated with adverse metabolic markers and CAC. It outperformed EAT volume in discriminating metabolic syndrome (AUC, 0.73 versus 0.69) and, over 16 months, lower density predicted higher risk of HF readmission and composite outcomes (p<0.05) |
| Frassens et al. (2017) SMART study20 | Patients with a history of symptomatic vascular disease, type 2 diabetes mellitus or hypertension were included | 140 | EAT density and CAC | Lower EAT density was associated with greater coronary calcium burden, with each SD decrease linked to 1.77-fold higher odds of being in a higher CAC density tertile after adjusting for age, sex and CABG history |
| Geoller et al. (2018) 18 | Randomly selected subjects from the EISNER study. Participants were middle-aged subjects, with cardiovascular risk factors, but no prior known CAD | 456 | EAT volume and density were examined in relation to CCS, inflammatory biomarkers and MACE | CAC: EAT volume was significantly greater in subjects with coronary calcium compared to those without (89 versus 74 cm3; p<0.001), although this difference was only evident in early atherosclerosis. EAT density was lower in individuals with coronary calcium than in those without (-76.9 versus -75.7 HU; p=0.024). Moreover, subjects with advanced atherosclerosis exhibited significantly lower EAT density compared to those with early disease (p=0.011) |
| Geoller et al. (2018) 18 | Randomly selected subjects from the EISNER study. Participants were middle-aged subjects, with cardiovascular risk factors, but no prior known CAD | 456 | EAT volume and density were examined in relation to CCS, inflammatory biomarkers and MACE | Biomarkers: EAT volume correlated positively with PAI-1, MCP-1, VCAM-1, triglycerides and myoglobin, and inversely with adiponectin, angiotensinogen and HDL-C (all p<0.05). In contrast, higher EAT density was associated with adiponectin, sICAM-1 and HDL-C, and inversely with PAI-1, LDL-C and triglycerides |
| Geoller et al. (2018) 18 | Randomly selected subjects from the EISNER study. Participants were middle-aged subjects, with cardiovascular risk factors, but no prior known CAD | 456 | EAT volume and density were examined in relation to CCS, inflammatory biomarkers and MACE | MACE: Patients with MACE had higher EAT volumes and lower densities than those without events (p<0.001 for both). In adjusted Cox analysis, EAT density remained more strongly associated with MACE (HR, 0.8; 95% CI, 0.7–0.98; p=0.029) than EAT volume or CAC score |
*SCOT-HEART trial included clinical patients with suspected angina caused by coronary heart disease, who were followed up for 5 years post CCTA for clinical outcomes.
†AdipoRedOx study involves in-patient post-cardiac surgery AF (>30 s of AF on monitoring) and long-term AF (paroxysmal, persistent or chronic) following surgery.
ACS = acute coronary syndrome; AF = atrial fibrillation; AUC = area under curve; BMI = body mass index; CABG = coronary artery bypass grafting; CAC = coronary artery calcium; CAD = coronary artery disease; CCS = coronary calcium score; CCTA = coronary computed tomography angiography; CI = confidence interval; EAT = epicardial adipose tissue; HDL-C = high-density lipoprotein cholesterol; HF = heart failure; HFpEF = heart failure with preserved ejection fraction; HR = hazard ratio; HRPF = high-risk plaque feature; LDL-C = low-density lipoprotein cholesterol; MACE = major adverse cardiovascular event; MCP-1 = monocyte chemoattractant protein-1; MI = myocardial infarction; OR = odds ratio; PAI-1 = plasminogen activator inhibitor-1; SD = standard deviation; sICAM-1 = soluble intercellular adhesion molecule-1; VCAM-1 = vascular cell adhesion molecule-1.
In the SCOT-HEART trial, West et al. found that EAT volume was associated with CAD, atrial fibrillation, predicted all-cause mortality, myocardial infarction and stroke, independently of risk factors.34 Notably, West et al. demonstrated that EAT volume serves as a predictor of all-cause mortality, even when cardiac deaths are excluded. This finding implies that EAT may have broader relevance in systemic metabolic disorders beyond its recognized link to atherosclerotic coronary disease.34
Whereas volume reflects anatomical burden, EAT density reflects tissue composition and inflammation. It has previously been shown that in subcutaneous and visceral adipose tissue, low attenuation or density is associated with a more adverse metabolic profile, even after adjusting for volume.37 Interestingly, Abraham et al. found that in women, this was more predictive of cardiovascular risk and disease than volume.37 Studies have shown that EAT density, not volume, is a better prognosticator of CAD.35 In the ROMICAT II trial, it was found that low attenuation EAT was associated with high-risk plaque features.36 Interestingly, in patients with heart failure with preserved ejection fraction, higher EAT density was associated with improved outcomes.22 Specifically, for every 10 HU increase in EAT density, the incidence of heart failure with improved reached 84.5%.22
Erley et al. recently demonstrated that lower EAT density at the level of the left main coronary artery was independently associated with myocardial ischaemia, highlighting the prognostic value of density measurements beyond EAT area or coronary calcium scoring.38 Similarly, Goeller et al. found that patients with EAT density values below -75 HU were significantly more likely to experience myocardial infarction and cardiac death than those with higher attenuation values.18 Notably, when incorporated into a Cox regression model, EAT density demonstrated a stronger independent association with MACE than EAT volume.18
Goeller et al. also found that EAT density was found to correlate positively with serum adiponectin levels and inversely with PAI-1 concentrations.18 This is significant, as adiponectin is an anti-inflammatory, vasoprotective adipokine, while PAI-1 is a pro-thrombotic marker linked to endothelial dysfunction and atherosclerotic progression. While these associations have previously been observed in relation to EAT volume, their correlation with EAT density highlights the added value of attenuation as a marker of adipose tissue inflammation and cardiovascular risk.39,40
Similarly, in the SMART study, Franssens et al. found that in men, low-density EAT was associated with higher CAC burden in those with CVD or high risk, independently of BMI or EAT volume.20 They also found that lower EAT density was not necessarily associated with wider spread calcium burden over the coronaries, but rather with higher calcium density per plaque.20
Therapeutic modulation of EAT
Sodium–glucose co-transporter 2 inhibitors
SGLT2-i have demonstrated substantial benefits in cardiovascular outcome trials. While their primary mechanism involves renal glucose excretion, these agents also exert pleiotropic effects on adipose tissue. In a recent meta-analysis of randomized trials, SGLT2-i were associated with a significant reduction in EAT thickness compared with placebo or GLP-1 therapy.40 Notably, this effect appeared independent of overall weight loss, suggesting direct metabolic effects on EAT in population with type 2 diabetes (T2D).41,42
Mechanistically, SGLT2-i reduce pro-inflammatory cytokine secretion and improve the secretome of EAT in a cardioprotective direction.42 Importantly, EAT expresses SGLT2 receptors – unlike the myocardium – positioning it as a perfect target for this therapy.43 Diaz et al. found that, among other benefits, SGLT2-i improve EAT cell differentiation, increase glucose uptake by EAT and promote wound healing in the endothelial cells.44 In patients with heart failure (EF>50%), with or without CAD, it has been shown that EAT has lower glucose uptake and utilization compared with other fat depots, highlighting the potential benefit of this drug in this population.45
Glucagon-like peptide-1 receptor agonists
GLP-1RAs, such as liraglutide and exenatide, have also demonstrated reductions in EAT volume. In patients with T2D, liraglutide significantly decreased EAT thickness in a rapid manner, around 40% reduction, with 30% occurring within the first 3 months. MRI studies further confirmed that exenatide reduced both EAT and hepatic fat content; similarly, the STOP trial demonstrated that semaglutide significantly reduced hepatic steatosis compared with placebo.46–48
On a molecular level, EAT expresses GLP-1 receptors, and their activation upregulates genes that promote fatty acid oxidation and white-to-brown fat transdifferentiation.49 This suggests that GLP-1RAs not only reduce EAT size but may also improve its inflammatory and metabolic profile.49 Interestingly, these receptors were also found on macrophages within EAT, which can position GLP-1 agonists as a great therapy, given that low-density EAT is associated with increased M1 macrophages and inflammation.
Exercise and lifestyle interventions
Exercise is another effective method of modulating EAT. In rodent models, increased physical activity has been shown to raise HU values of brown adipose tissue (BAT), reflecting a shift towards a more metabolically active, ‘brown-like’ phenotype.50 Both aerobic and resistance training have been associated with significant reductions in EAT thickness, even with less per cent reduction in BMI comparatively.51 This supports the hypothesis that EAT is metabolically active and responsive to systemic improvements in insulin sensitivity and inflammation. It has also been shown in pigs that peri-myocardial EAT has a reduced inflammatory response after aerobic exercise.52
Finally, exposure to cold environments has been shown to increase HU values of BAT in both rodent and human models.50,53 Interestingly, in rodent models, BAT exposed to warmer temperatures demonstrated an increase in activated M1 macrophages, as well as whitening of the BAT.54 Whether these observations extend to EAT remains unclear, but they offer an intriguing avenue for exploration into how environmental factors may modulate its inflammatory behaviour.
Limitations
EAT quantification methods range from simple slice-based measurements to semi-automated tracing and fully automated volumetric approaches, each differing in scope, reproducibility and operator dependence. This heterogeneity, along with inconsistent HU thresholds (-250 to -190 HU lower, -50 to -30 HU upper), contributes to variability across studies.18,20,38 Monti et al. reported a pooled mean EAT density of -85.9 HU, which was lower in healthy subjects and higher in those with CAD.55 Despite its growing prognostic value, clinical use is limited by CT access and cost, lack of modality standardization, the need for workflow integration and the absence of validated thresholds. Future work should establish reference ranges and cost-effectiveness to enable routine risk stratification. A potential limitation also lies in the cross-sectional nature of most available studies, which allows only inference of associations rather than causality.
Future directions and conclusions
The natural history of EAT is still incompletely understood. To move towards clinical integration, standardized, automated quantification of EAT is essential. In a deep-learning study, West et al. demonstrated that EAT volume could be accurately quantified using artificial intelligence in patients who were technically challenging. Volume thresholds for several cardiovascular pathologies were ultimately quantified (i.e. atrial fibrillation, myocardial infarction (MI) and stroke). Such data-driven cut-offs could facilitate population-level risk stratification and set the stage for routine EAT reporting on CT scans.34
Additionally, Commandeur et al. developed a machine learning model combining EAT measures with coronary calcium and clinical risk scores. This model not only outperformed the traditional clinical risk assessment for MI and cardiac death, but also highlights the inevitable shift towards personalized medicine with the help of AI, in the setting of preventative medicine.56
Looking ahead, future research should aim to determine whether therapeutic modulation of EAT – particularly interventions that alter its density and inflammatory profile – can translate into meaningful reductions in cardiovascular events. Given its emerging role, EAT density warrants further investigation as a potential imaging biomarker, not only for risk stratification but also as a therapeutic target. Characterizing EAT, especially attenuation metrics, in prospective cohorts could establish its utility in primary prevention and support integration into routine cardiovascular risk assessment.


